Question
Year over Year Income Graph Like The One On My QB Mac
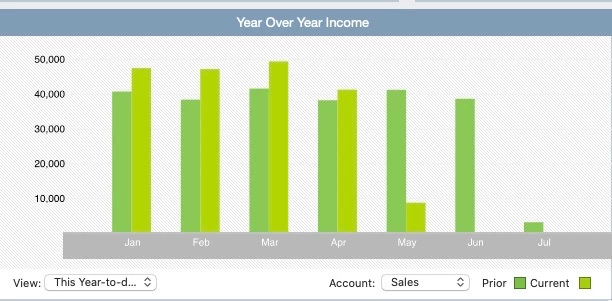
Since I had to forcefully move from my QB Mac to QB Online, I can no longer see reports that I used to have access to. One that I cannot see or use anymore was the Year over Year Income viewed as sales by month and year to date. See photo. Since this is no longer available to me, does anyone know how to set this up on a spreadsheet ? This is a lot more work than it used to be.