Create charts to see your business performance in QuickBooks Online
by Intuit• Updated 5 days ago
Learn how to build charts to see your business performance in QuickBooks Online.
If you're a QuickBooks Online Accountant or Advanced user, check out our guide on building these charts in QuickBooks Online Advanced and Accountant.
Every business tracks unique metrics to measure its performance.
Create custom charts to track what matters most to your business. You choose the metric and the specific data the chart will include, like products, services, and locations. For some charts, you can even compare your numbers to other businesses in your industry.
Here’s how to work with custom charts. Note: You need to be an accountant user in QuickBooks Online to use this feature.
See your charts in the performance centre
The performance centre shows all your charts in one place. To see it:
Follow this link to complete the steps in product ![]()
- Select the Performance Centre tab.
When you first visit the performance centre, QuickBooks has some built-in charts ready for you to look at. You can customise them to meet your needs or delete them. See below for details on how to customise and edit a chart.
Create a chart
You can track one metric in each chart, and create up to 25 charts.
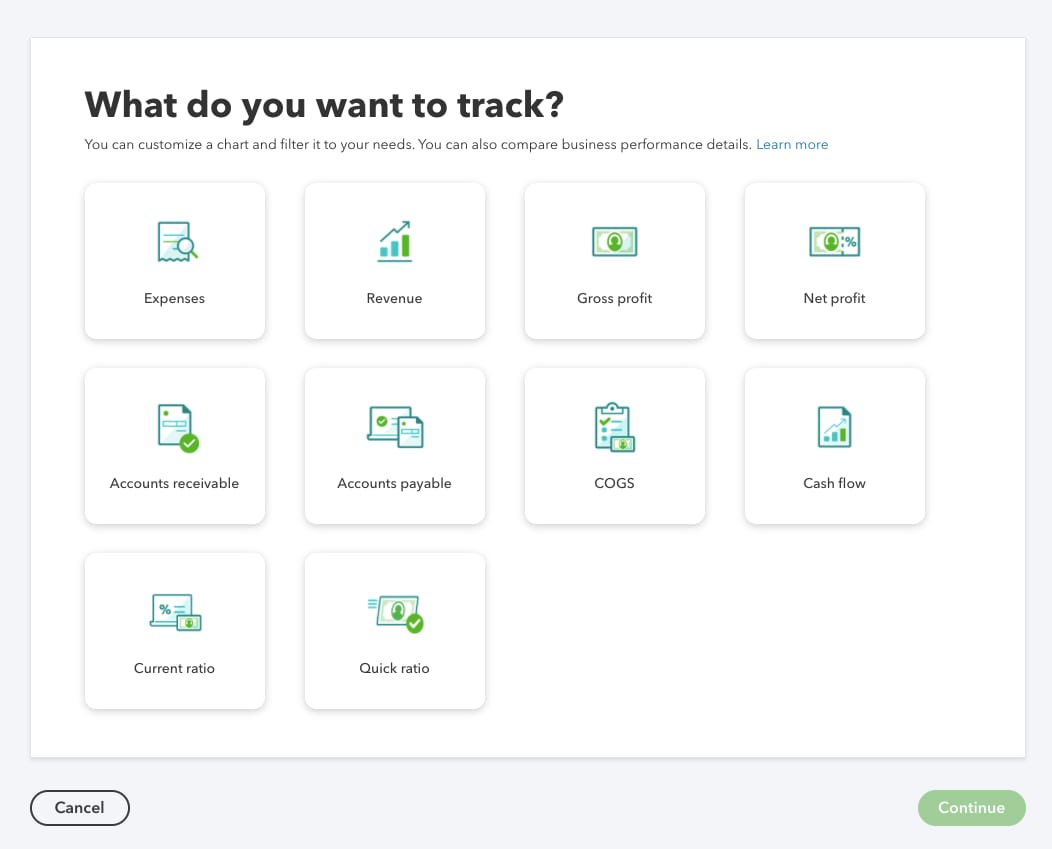
Here are the metrics you can create charts for:
- Expenses
- Revenue
- Gross profit
- Net profit
- Accounts receivable
- Accounts payable
- COGS (Cost of goods sold)
- Cash flow
- Current ratio
- Quick ratio
Start with a quick chart
Want to create a chart for a common metric like revenue or expenses over time? Just select Quick add charts, then select the metric from the list. The chart appears instantly on your dashboard. From there you can customise it.
- To change the time period, select the current time period, then select an option from the dropdown.
- To go deeper into the data, select the vertical ellipsis ⋮, then select Edit Widget. You can group the data by categories, apply filters, or compare the results to a previous time period. For more details, see the steps below for creating a chart from scratch.
Create a chart from scratch
- Select +Add new chart.
- Select the metric you want this chart to track. Then select Continue.
This opens a customisation window. As you make selections, the preview updates to show you exactly what the chart will look like.
- Give your chart a name.
- Select the type of chart, such as Trend line, Vertical bar, or Pie chart. These options vary based on the metric.
- In the Time period dropdown, select the time period you want to track.
- In the Group by dropdown, select the category you want to group your data by. You can group by classes, suppliers, locations, or other categories. In the Select from multiple dropdown, select the items in the category you want to track. These are what appear in the bars or lines of the chart.
- If you want to see only data from a specific category, select it in the Filter by dropdown. Then use the Select from multiple dropdown to narrow it to items in that category.
Tip: The Group by dropdown determines the type of data the chart will track. The Filter dropdown is where you decide what specific data is included. For instance, you may only want to see data when it applies to specific classes or locations. You can have up to 10 filters. - To compare the results over different time periods, select Compare. Then select Previous period or Previous year same period. For some charts, you can also compare against a budget or goal.
- When you're done, select Add to Dashboard.
When you go back to the performance centre, you'll see your new chart.
Edit or delete a chart
Success metrics always need fine-tuning. You can adjust your charts at any time:
Follow this link to complete the steps in product ![]()
- Select the Performance Centre tab.
- Find the chart.
- Select the vertical ellipsis ⋮ on the chart and then Edit. To delete the chart, select Delete chart.
- Make the changes you need. Then select Save.
More like this
- Create charts to see your business performanceby QuickBooks
- Customise your reports with a modern viewby QuickBooks
- Learn about the chart of accounts in QuickBooks Onlineby QuickBooks
- Run reports by classby QuickBooks