Customize reports in QuickBooks Online using modern view
by Intuit• Updated 1 week ago
Learn how to create custom reports in QuickBooks Online using modern view. The steps may vary depending on your QuickBooks subscription.
| Important: Starting in July 2024, we will slowly roll out a new reporting experience for Standard Reports called Modern View. In the Reports center, if you see this We will gradually make Modern View available for all Standard Reports and remove Classic View, meaning you will no longer be able to switch between the two views. To learn more about this change, see the Frequently asked questions in this article. |
Select the appropriate heading based on your subscription for the complete steps.
Chapters:
0:27 - Create a report
0:56 - Sort and group data
4:21 - Using pivot tables
Create a custom report
Create a report using a wizard or from scratch. If you haven’t yet, sign in to QuickBooks Online as an administrator.
- Go to Reports (Take me there) and select + Create new report.
- Select the report type, then select Create. Note: Based on the experience you see, you might see the following two options instead. Select an appropriate one:
- Start by report creation wizard: Search for the report type. Example: Invoices by customer name.
- Start by adding data columns: From the Edit tab, manually select the columns you wish to add to your report. You can then re-order or hide/un-hide these columns from the Reorder tab.
- Select the pencil icon
 , then enter/edit the name of your report.
| Customization Options (steps may vary based on report type) | What you can do |
| Date range dropdown▼ | Select the date coverage of your generated data. |
| Pivot | Select Pivot to summarize and total your report data. Here’s how: 1. Select which fields to categorize in the rows and columns, then select which value field you want to summarize. 2. Select Show totals to add a totals row or column. 3. Once you've selected Rows, Columns, and Values, the report view displays as a pivot table. Switch off Show Pivot Table to return to the original view. |
| Group | Select Group to categorize line items by any column. You can select up to 3 columns to group data. Select Edit group calculations ▼ to calculate totals, averages, or percentages for numeric groups. Tip: When a report is grouped, select expand ▼ to view the details inside that group. When you select a column to group by hierarchy, it automatically becomes the first column on the report. You won’t be able to hide this column. When you select a hierarchical group, you can’t use any other groups to customize your report. |
| Filter | Select Filter to view only certain entries. Select what you want to filter by, select the operation, then select from the provided values. Tip: You can apply multiple filters on multiple lines using And / Or. Choose from one of several columns from the Columns panel and it will also be available under filters. |
| General options | Change things like the accounting method, number format, or the header/footer fields to be included or the alignment. Select Accounting method to see the difference another accounting method will make in your reporting. You can customize an individual report to use a different accounting method and compare the results. Select Number format to to divide the number by 1,000 or include cents or zero amounts on the report. Modify with fixed periods or custom ranges. Select Aging to categorize outstanding balances by days past due. Based on the current date or the report date. Select Header/Footer to decide what appears in the report header and footer. You can also change the header and footer alignment too. |
| Columns | 1. Select Columns, look for a topic you want to report on, then select it to reveal the available fields. 2. Select any field you want to view in the report. Note: Some fields may not work in a report together. When you select a field, non-compatible fields will be unavailable. If you use custom fields, they appear in this list. 3. To change the order in which selected fields appear, select Reorder, then select and drag the listed fields in the order you want. Check or uncheck boxes next to column names to include or exclude them from your report. |
- Select Save As to save your report. You can edit the report at any time.
Tip: Select the Export/Print dropdown ▼, then select Export to Excel, and follow the steps to export your data to a spreadsheet to store and access it in the future.
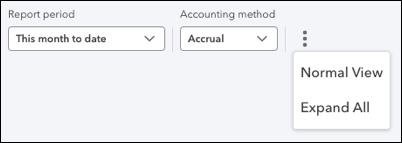
The customization options ![]() toward the top of the report allow you to:
toward the top of the report allow you to:
- expand or collapse all groups on the report.
- alter the density of data on the report from compact to normal.
Refresh data on the report by selecting the refresh icon ![]() . Report data also updates whenever you customize so you don’t need to Run report.
. Report data also updates whenever you customize so you don’t need to Run report.
To get even more space for your reports, select the ∧ icon to collapse the top header.
View your custom reports
If you haven’t yet, sign in to QuickBooks Online as an administrator.
- Go to Reports (Take me there) and select the Custom reports tab.
- Select the report name to open it.
Tip: If you want to view any transaction in your report, select any field in the report row to open the transaction.
Visualize your report
Visualize your report with a chart view to create presentation-ready charts of your report data.
- Open your custom report.
- Select Chart View.
- Select a Chart Type to see how you want to visualize your data.
- Adjust which field displays on the Horizontal (X) axis and the Vertical (Y) axis by selecting an option in the dropdowns.
- From the Split by dropdown ▼, select an appropriate value, if needed.
- Select Save.
Add a chart report to Management reports
You can add chart reports to Management reports to show visualized data:
- While viewing your report in Chart View, go to More actions
 and select Add to Management reports.
 - Select either Create a new management report or Add to an existing management report.
- Either enter the name of the new management report, or select an existing management report.
- Select Add.
Add a chart report to your Performance center
Here is how you can add your customized chart report to your Performance center as a widget:
- While viewing your report in Chart View, go to More actions and select Add to Performance center.
- A push notification shows that your report was successfully added. To view the widget, select "Click here to view" in the notification.
Schedule an emailed report
Here's how to schedule custom reports:
- Choose one of the following starting points:
- From the Standard or Custom reports tab, select more options
 next to any report that is available in the New Enhanced Experience. Then, select Create a schedule.
 - Open a report that is available in the New Enhanced Experience, select More actions ▼, then Schedule report.
- From the Standard or Custom reports tab, select more options
- Enter a Workflow name.
- Select a start date, then choose how often you want the report to be sent.
Ex: If you want the report sent every other Monday, enter 2, select Week, then select Mo. - Enter the email address you want to send the report to.
- Fill out a desired Subject and Message.
- Select Save and enable.
To view the schedule, go to Custom reports, select View all schedules from the Action ▼ dropdown for the relevant report, then select the schedule.
Note: If you need to turn off the scheduled report or update the frequency, go to Settings ![]() , then select Manage workflows. Here’s how you can learn more about how to create and manage workflows.
, then select Manage workflows. Here’s how you can learn more about how to create and manage workflows.
| Customization Options (steps may vary based on report type) | What you can do |
| Date range dropdown▼ | Select the date coverage of your generated data. |
| Group | Select Group to categorize line items by any column. You can select up to 3 columns to group data. Select Edit group calculations ▼ to calculate totals, averages, or percentages for numeric groups. Tip: When a report is grouped, select expand ▼ to view the details inside that group. When you select a column to group by hierarchy, it automatically becomes the first column on the report. You won’t be able to hide this column. When you select a hierarchical group, you can’t use any other groups to customize your report. |
| Filter | Select Filter to view only certain entries. Select what you want to filter by, select the operation, then select from the provided values. Tip: You can apply multiple filters on multiple lines using And / Or. Choose from one of several columns from the Columns panel and it will also be available under filters. |
| General options | Change things like the accounting method, number format, or the header/footer fields to be included or the alignment. Select Accounting method to see the difference another accounting method will make in your reporting. You can customize an individual report to use a different accounting method and compare the results. Select Number format to to divide the number by 1,000 or include cents or zero amounts on the report. Modify with fixed periods or custom ranges. Select Aging to categorize outstanding balances by days past due. Based on the current date or the report date. Select Header/Footer to decide what appears in the report header and footer. You can also change the header and footer alignment too. |
| Columns | 1. Select Columns, look for a topic you want to report on, then select it to reveal the available fields. 2. Select any field you want to view in the report. Note: Some fields may not work in a report together. When you select a field, non-compatible fields will be unavailable. If you use custom fields, they appear in this list. 3. To change the order in which selected fields appear, select Reorder, then select and drag the listed fields in the order you want. Check or uncheck boxes next to column names to include or exclude them from your report. |
Select Save As to save your report. You can edit the report at any time.
Tip: Select the Export/Print dropdown ▼, then select Export to Excel, and follow the steps to export your data to a spreadsheet to store and access it in the future.
The customization options ![]() toward the top of the report allow you to:
toward the top of the report allow you to:
- expand or collapse all groups on the report.
- alter the density of data on the report from compact to normal.
Refresh data on the report by selecting the refresh icon ![]() . Report data also updates whenever you customize so you don’t need to Run report.
. Report data also updates whenever you customize so you don’t need to Run report.
To get even more space for your reports, select the ∧ icon to collapse the top header.
View your custom reports
If you haven’t yet, sign in to QuickBooks Online as an administrator.
- Go to Reports (Take me there) and select the Custom reports tab.
- Select the report name to open it.
Tip: If you want to view any transaction in your report, select any field in the report row to open the transaction.
Schedule an emailed report
Here's how to schedule custom reports:
- Choose one of the following starting points:
- From the Standard or Custom reports tab, select more options next to any report that is available in the New Enhanced Experience. Then, select Create a schedule.
- Open a report that is available in the New Enhanced Experience, select More actions ▼, then Schedule report.
- From the Standard or Custom reports tab, select more options
- Enter a Workflow name.
- Select a start date, then choose how often you want the report to be sent.
Ex: If you want the report sent every other Monday, enter 2, select Week, then select Mo. - Enter the email address you want to send the report to.
- Fill out a desired Subject and Message.
- Select Save and enable.
To view or disable the schedule, go to Custom reports, select View all schedules from the Action ▼ dropdown for the relevant report, then select the schedule.
Frequently asked questions about Modern view reporting
For years, QuickBooks Online customers have requested reporting be improved but the legacy platform on which QuickBooks Online reporting was built restricted what we could do at speed. To support the needs of all our customers in the future, we decided to move QuickBooks Online reporting to a new platform which we’re aiming to complete before 2025. As we’ve introduced new features such as Custom Report Builder, we had to determine how they would fit into the existing reports interface and eventually, we decided some changes were needed. These changes are what led to Modern View.
Classic view is built on our legacy platform which we’re aiming to shut down before 2025. We are unable to maintain both the legacy and new reporting platforms, so Classic view must go away. However, where possible, we're making Modern view closely resemble Classic view to limit the number of visual changes users must adopt.
We’re aiming to remove Classic View from all Standard Reports and customized versions of those reports before 2025. Classic View will gradually be removed report by report between July 2024 and beginning of 2025. This timeframe is the same for all customers in every country and every QuickBooks Online subscription plan. A notification will appear in the affected report when that report is 30 days or more away from having Classic view removed. A list showing all Standard reports in QuickBooks Online and the availability of Classic and Modern view can be found here.
Features vary depending on your QuickBooks Online subscription plan and your country of operation, but generally, all customers get:
- Faster loading times and fewer crashes for reports with lots of lines
- Improved user permissions for reporting to ensure your data is secure when multiple users are using QuickBooks Online
- Immediately preview customizations before saving your report
- More customization options including advanced filters, data pivots, charting of your data, and the ability to bring new data from QuickBooks Online and other QuickBooks products into a report.
- New reports for Fixed Assets, Revenue Recognition, and Projects.
- Ability to run any report directly from Microsoft Excel.
- Ability to add any report into Management Reports.
We'll post a notification in the report at least 30 days before Classic view is scheduled to be removed from that specific report.
Sign in now for personalized help
See articles customized for your product and join our large community of QuickBooks users.
More like this
- Customize reports in QuickBooks Onlineby QuickBooks•1735•Updated May 28, 2024
- Run reports in QuickBooks Onlineby QuickBooks•922•Updated May 29, 2024
- Customize invoices, estimates, and sales receipts in QuickBooks Onlineby QuickBooks•5406•Updated 1 week ago
- Common custom reports in QuickBooks Onlineby QuickBooks•407•Updated May 29, 2024
- Create journal entries in QuickBooks Onlineby QuickBooks•8783•Updated 1 month ago