Introducing simple e-invoicing!
Fully LHDN compliant on all
QuickBooks plans.
Introducing simple e-invoicing!
Fully LHDN compliant, integrated
with QuickBooks online Accountant.
FINAL DAYS
70% off
for 3 months
FINAL DAYSStart fresh this new year with QuickBooks Online
DON'T MISS OUT
Buy now and get 70% off for 3 months Claim offer
DON'T MISS OUT
Claim offer
SALE
Buy now and
save up to 50% off today
See plans + pricing
Choose your... Country Language
A person holding a pen and a paper.
Running a business

How to Calculate Gross Profit Margin: Step by Step Guide

Every business needs a clear understanding of its profitability. One of the most important financial metrics for this is the gross profit margin. By using the gross profit margin formula, businesses can measure how efficiently they’re producing and selling goods compared to the costs of making them.

Knowing how to calculate profit margins is important for pricing strategies, identifying cost inefficiencies, and tracking overall performance. The gross profit margin formula offers companies a straightforward benchmark for business performance and planning.

Key takeaways

  • Gross profit margin measures how much revenue remains after subtracting the cost of goods sold (COGS).
  • The gross profit margin formula is: (Gross Profit ÷ Net Sales) × 100
  • Learning how to calculate profit margin step-by-step helps businesses evaluate their efficiency and pricing strategies.
  • A higher margin indicates stronger profitability, while a lower margin may highlight rising costs or inefficiencies.
  • Factors such as industry, seasonality, region and competition can influence margin calculation results.
  • Net profit margins and operating profit margins are related but separate formulas, offering different financial insights.

What is the gross profit margin?

The gross profit margin represents the percentage of revenue a business keeps after subtracting the cost of goods sold (COGS). It tells you how much money is left over to cover operating expenses, taxes, and profit.

Here’s why it matters:

  • It focuses only on revenue and direct production costs, not overhead. Gross profit margin doesn’t include operating expenses like rent, salaries, or utilities. Instead, it looks strictly at sales revenue against direct costs such as raw materials, and labour. This makes it a clear measure of how efficiently a business produces and sells its goods before other expenses come into play.
  • It helps businesses measure efficiency in producing and selling goods. By comparing sales revenue to COGS, businesses can quickly see whether their production process is cost-effective. A higher margin indicates efficient use of resources and strong pricing strategies, while a lower margin could suggest waste, inefficiency, or rising costs in the supply chain.
  • It’s a valuable metric for comparing performance across industries. Gross profit margin offers a way to benchmark success. For example, a 30% margin might be excellent in retail but considered low in software. In Malaysia, where industries like construction and retail operate on very different cost structures, understanding your gross profit margin helps you set realistic goals and compare performance with similar businesses.

According to a 2025 study published by Pertanika University, “profitability (measured by gross margin)” is one of the key financial indicators used in assessing Malaysian firms.

Gross profit vs gross margin?

Although often used interchangeably, gross profit and gross margin are not the same. This table highlights the key difference between the two:

Term

Definition

Example

Gross Profit

The raw amount left after subtracting COGS from revenue.

RM 150,000

Gross Margin

The percentage of revenue remaining after subtracting COGS.

45%

The gross profit margin formula 

Here’s how to calculate profit margin percentage with one simple formula:

Gross Profit Margin = (Gross Profit ÷ Net Sales) × 100

This formula shows the proportion of sales revenue that exceeds COGS. A higher percentage indicates better profitability, while a lower percentage may signal rising costs or pricing issues. 

How to calculate the gross profit margin 

This section provides a step-by-step guide on how to calculate profit margins:

1. Determine net sales (turnover)

Net Sales = Gross Sales – Returns – Discounts

This figure reflects the actual money earned from sales after deductions.

2. Calculate cost of goods sold (COGS)

COGS = Beginning Inventory + Purchases – Ending Inventory

This represents the direct costs of producing goods.

3. Determine the gross profit value

Gross Profit = Net Sales – COGS

Gross profit value shows the amount left after covering production costs.

4. Apply the gross profit margin formula

Gross Profit Margin = (Gross Profit ÷ Net Sales) × 100

Insert the values to find the percentage.

5. Evaluate results

  • High margin: Indicates efficiency and profitability.
  • Low margin: Suggests higher costs, pricing issues, or operational inefficiencies. 

You should always compare your results with industry benchmarks for context.

Gross profit margin examples 

Here, we’ll look at examples of how the gross profit margin can be applied in two different commercial settings:

Example 1: Retail 

A retail shop in Kuala Lumpur records the following for August:

  • Gross Sales: RM50,000
  • Returns & Discounts: RM2,000
  • Beginning Inventory: RM10,000
  • Purchases: RM20,000
  • Ending Inventory: RM8,000

Step 1: Net Sales = 50,000 – 2,000 = RM48,000

Step 2: COGS = 10,000 + 20,000 – 8,000 = RM22,000

Step 3: Gross Profit = 48,000 – 22,000 = RM26,000

Step 4: Gross Profit Margin = (26,000 ÷ 48,000) × 100 = 54.2%

A margin of 54.2% is relatively healthy for a retail shop. This indicates the business is managing its production costs efficiently. To get meaningful insights, compare this figure with industry benchmarks in Malaysia—for example, retail margins often range between 30–60%, depending on the product mix.

Example 2: Construction 

A small construction firm in Penang completes a project with these figures:

  • Gross Sales (project revenue): RM500,000
  • Returns & Discounts: RM0 (common in contracts)
  • Beginning Inventory (materials on hand): RM50,000
  • Purchases (cement, steel, subcontractor services): RM300,000
  • Ending Inventory (unused materials): RM30,000

Step 1: Net Sales = 500,000 – 0 = RM500,000

Step 2: COGS = 50,000 + 300,000 – 30,000 = RM320,000

Step 3: Gross Profit = 500,000 – 320,000 = RM180,000

Step 4: Gross Profit Margin = (180,000 ÷ 500,000) × 100 = 36%

A margin of 36% indicates that after covering the cost of materials and subcontractors, the firm keeps RM0.36 for every RM1 of revenue earned. In construction, gross profit margins are typically lower than retail or services because projects are labour and material-intensive. Margins can also vary depending on the type of project—residential jobs may have higher margins than large infrastructure contracts.
Influencing margin factors 

Several factors can affect the measurement of gross profit margin. Understanding these helps you interpret your results more accurately:

  • Industry: Different industries naturally operate with different margin levels. For example, retail often enjoys higher margins, while construction or manufacturing tends to have tighter margins due to material and labour costs.
  • Time of year: Seasonal demand can impact margins. For instance, retail businesses in Malaysia may see stronger margins during festive seasons like Hari Raya, while quieter months may reduce profitability.
  • Region: Location affects both costs and revenue potential. Operating in urban centres like Kuala Lumpur may mean higher sales volumes, but also higher rent and labour expenses compared to smaller towns.
  • Business type: Service-based businesses often have lower direct costs (and therefore higher margins) compared to product-based businesses that rely on raw materials and inventory.
  • Market competition: In highly competitive markets, businesses may lower prices to stay competitive, which reduces margins. In niche or specialised markets, less competition may allow for stronger margins.
  • Change in demand: Shifts in consumer preferences or economic conditions can alter sales volumes, impacting margins. For example, a sudden drop in demand may leave a business with high fixed costs spread over fewer sales.
  • Rising costs: Increases in raw materials, utilities, or labour directly raise the cost of goods sold (COGS), which lowers gross profit margins if sales prices remain unchanged.

When to reevaluate gross profit margins:

Gross profit margins shouldn’t be reviewed just once—they should be monitored throughout the year. It’s good practice to reevaluate margins whenever you conduct a financial performance audit or analysis (monthly, quarterly, or annually). This ensures you can quickly identify problems, adjust pricing, reduce costs, or adapt strategies in response to changing conditions. 

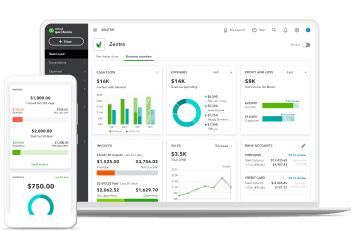
QuickBooks accounting software makes it easy to generate instant financial reports, so you can keep an eye on your gross profit margins and make adjustments when necessary. You can also get a 360° view of your sales by filtering data by customer, product, project, or location.

The difference in margin formulas 

It’s easy to confuse margin formulas because they sound similar, but each measures profitability at a different stage:

  • Gross profit margin: Focuses only on sales revenue minus the cost of goods sold (COGS). It shows how efficiently you produce or sell your products.
  • Net profit margin: Includes all expenses, not just COGS. This covers operating costs, taxes, interest, and other expenses. It shows your business’s overall profitability after everything is paid.
  • Operating profit margin: Sits between gross and net. It includes COGS and operating expenses (like rent, salaries, and utilities), but not taxes or interest. It shows how profitable your core operations are before financing and tax.

Quick tip: Use gross margin to measure production efficiency, operating margin to evaluate day-to-day business performance, and net margin to see your final bottom line.

Utilise QuickBooks to track your gross profit margin 

Tracking your gross profit margin manually can be time-consuming and prone to errors. With QuickBooks, you can automate the process and gain accurate, real-time insights into your business’s performance. This not only saves time but also helps you make better financial decisions.

QuickBooks makes it easy to:

  • Generate instant financial reports  
  • Monitor income and expenses 
  • Create custom reports 
  • Track overdue invoices 
  • Collaborate with accountants or bookkeepers

Explore QuickBooks today and see how easy it is to track your gross profit margin. Try QuickBooks for free with a 30-day trial!

Related Articles