Need help choosing a plan?
Created with Sketch. 1800 917 771 Schedule a call
Need help?
We're here for you.
Schedule call
Created with Sketch.
A person in a blue shirt looking at a laptop.
inventory management

Inventory management in Excel

Inventory management is essential to maintaining the right stock levels, minimising storage costs and ultimately growing a business. For small businesses starting out with inventory management, Excel can be a useful tool to track stock and plan for demand.Β 

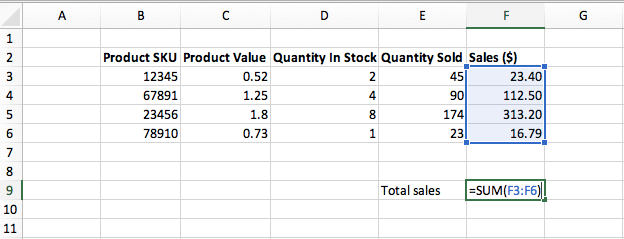
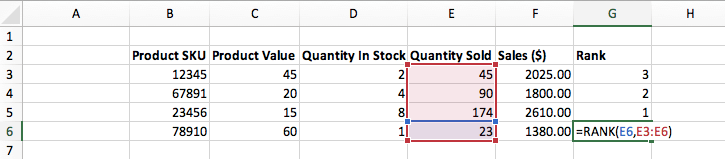
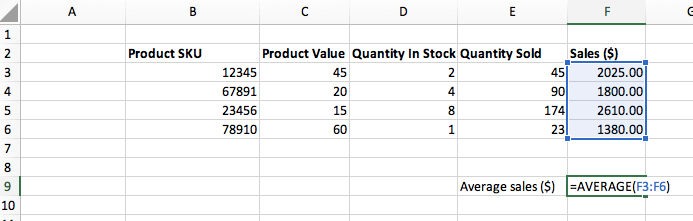
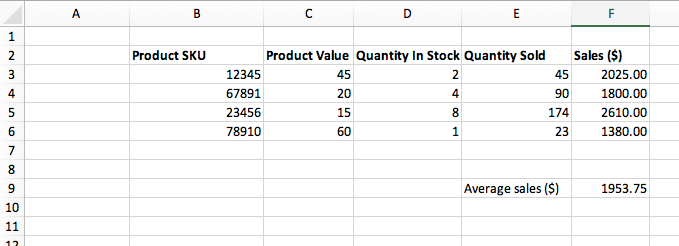
This guide covers the basics of Excel inventory management, including key inventory formulas for Excel.

How to use Excel for inventory management

Microsoft Excel is a good starting point for inventory management if your products are relatively simple and consistent. Once your business and product offering begins to grow, using dedicated inventory management software can make it easier to monitor stock levels and sales, so you don’t have to manually keep track.Β 

In the meantime, here’s how to get started managing inventory in Excel

1. Identify what needs to be monitored

The first step is to decide what inventory data you want to track. This might include:

  • Product names
  • SKUs
  • Product quantities
  • Product categories
  • Product costs (purchase and retail)
  • Inventory descriptions
  • Product locations

2. Create a spreadsheet

Once you know what information you’ll be tracking, create a spreadsheet and make a column for each data field you’ll be updating. You can do this by creating a spreadsheet from scratch or by customising an Excel inventory template.

3. Input the product details

Now it’s time to enter details for each of your products. Make sure to include information for each category (name, quantity, cost etc.) so there’s no missing data. It’s also worth double-checking your information to avoid any mistakes.

4. Update the document

Once your spreadsheet is ready to go, you’ll need to update it regularly so it accurately reflects your inventory. This includes updating stock levels after you make a sale, adding any new products and deleting discontinued lines.

Inventory management Excel formulas

Excel formulas are great shortcuts for tracking important metrics like total product quantities, values, days on the shelf and more. Here are some of the key inventory management Excel formulas to know:

SUM

The SUM formula adds values in two or more cells. It can be used to keep a running total of relevant inventory values, such as product quantities, inventory values and sales totals.Β 

The Excel SUM formula is:

=SUM(first cell*cell)

The SUM formula is used in the example below to calculate the total value of sales from cell F3 to cell F6:

Screenshot of how to manage inventory in Excel

SUMIF

The SUMIF adds together values that meet certain criteria. For example, you could choose to only add cells for a specific product category or only sales over a specified amount.

The SUMIF formula is as follows:

=SUMIF(RANGE,CRITERIA[sum_range])

RANK

The RANK formula allows you to rank data, for example number of products sold or total sales value. This formula is useful for tracking important metrics such as your most popular products.

The RANK formula is as follows:

=RANK(cell,cell:cell)

In the example below, the RANK formula is being used to rank products by quantity sold:

Screenshot of how to manage inventory in Excel

AVERAGE

The AVERAGE formula calculates the average value for a range of cells.Β 

The formula is as follows:

=AVERAGE(cell:cell)

In the example below, the AVERAGE formula is used to calculate the average sales value across all products:

Screenshot of how to manage inventory in Excel

AVERAGEIF

You can also use the AVERAGEIF formula, which calculates the average of all the cells in a range that meet a certain criteria. For example, you might want to calculate the average sales value of a particular product category.

The AVERAGEIF formula is as follows:

=AVERAGEIF(range, criteria, [average_range])

In the example below, the AVERAGEIF formula is being used to calculate the average sales value for all products in the Accessories category:

Screenshot of how to manage inventory in Excel

DAYS

The DAYS calculates the number of days between the dates displayed in specific cells. This is helpful for monitoring how long products have been on the shelf, and particularly useful if you store products that can spoil.Β 

The DAYS formula is as follows:

=DAYS(cell,cell)

In the example below, the DAYS formula is being used to calculate the number of days each product has been stored in the warehouse:

Screenshot of how to manage inventory in Excel

You can also use the NETWORKDAYS formula to calculate only the working days between two dates. That formula is as follows:

=NETWORKDAYS(cell,cell,[numberofholidays])

VLOOKUP

VLOOKUP allows you to search for a value in a table and enter it in a new cell. The VLOOKUP formula is as follows:

=VLOOKUP(cell,table array,column index)

In this formula:

  • β€œCell” is the information you want to look up
  • β€œTable array” is the range of cells in which you’re searching for the information
  • β€œColumn index” is the column number in the table where the data you’re looking for can be found

In the example below, VLOOKUP is being used to look up the total sales value for SKU #12345:

Screenshot of how to manage inventory in Excel

COUNTIF

COUNTIF only counts cells that meet specific criteria, for example a certain price or quantity.Β 

The COUNTIF formula is as follows:

=COUNTIF(range, β€œcriteria”)

So, if you wanted to only count entries that contained a unit price of $0.66, the formula would be:

=COUNTIF(range,”criteria”)

In the example below, the COUNTIF formula is used to count the number of products with a value over $40:

Screenshot of how to manage inventory in Excel

CONCATENATE

The CONCATENATE function combines different data from multiple cells into one cell. It’s often used to generate SKUs or unique product identifiers. In terms of inventory management in Excel, it’s often used to generate SKUs.

The formula is as follows:

=CONCATENATE(text1, text2, etc.)

In the example below, the CONCATENATE formula is used to generate SKUs by combining the product category code, manufacturer code and product ID.

Screenshot of how to manage inventory in Excel

Make inventory management easy with QuickBooks

While Excel is a great place to start with inventory tracking, a dedicated inventory management system can take care of the manual work for you so you can ditch the formulas and focus on growing your business.

QuickBooks Online allows you to manage your inventory, sales, finances and operational processes from one place. Unlike Excel and other basic inventory tools, QuickBooks also auto-updates your inventory levels and gives you stock updates and low stock alerts – so you can anticipate inventory shortages and stay stocked for success.

Find out more about inventory management with QuickBooks.


Related Articles

Looking for something else?

Get QuickBooks

Smart features made for your business. We've got you covered.

Help Me Choose

Use our product selector to find the best accounting software for you.

QuickBooks Support

Get help with QuickBooks. Find articles, video tutorials, and more.

Stay up-to-date with the latest small business insights and trends!


Sign up for our quarterly newsletter and receive educational and interesting content straight to your inbox.

Want more? Visit our tools and templates!

By signing up you are agreeing to our terms and privacy policy.

A happy small business owner signing up for the QuickBooks newsletter on laptop