


Most business owners understand profitability from a fundamental standpoint. If the revenue from sales covers your expenses, you’re turning a profit. Profits mean that your company is generating a positive cash flow, and positive cash flow helps keep your business in operation. Profitableness tends to be one of the primary goals of business owners, as they seek to have a profitable experience and capitalise on material gain.
However, business owners should look beyond a simple profit dollar amount. The basic dollar amount doesn’t indicate why the business is profitable. Analysing key metrics can help business owners determine whether their company is healthy, and if their profitability is sustainable. By calculating and comparing metrics, owners can identify the areas of the business that are working well, and those that need improvement.
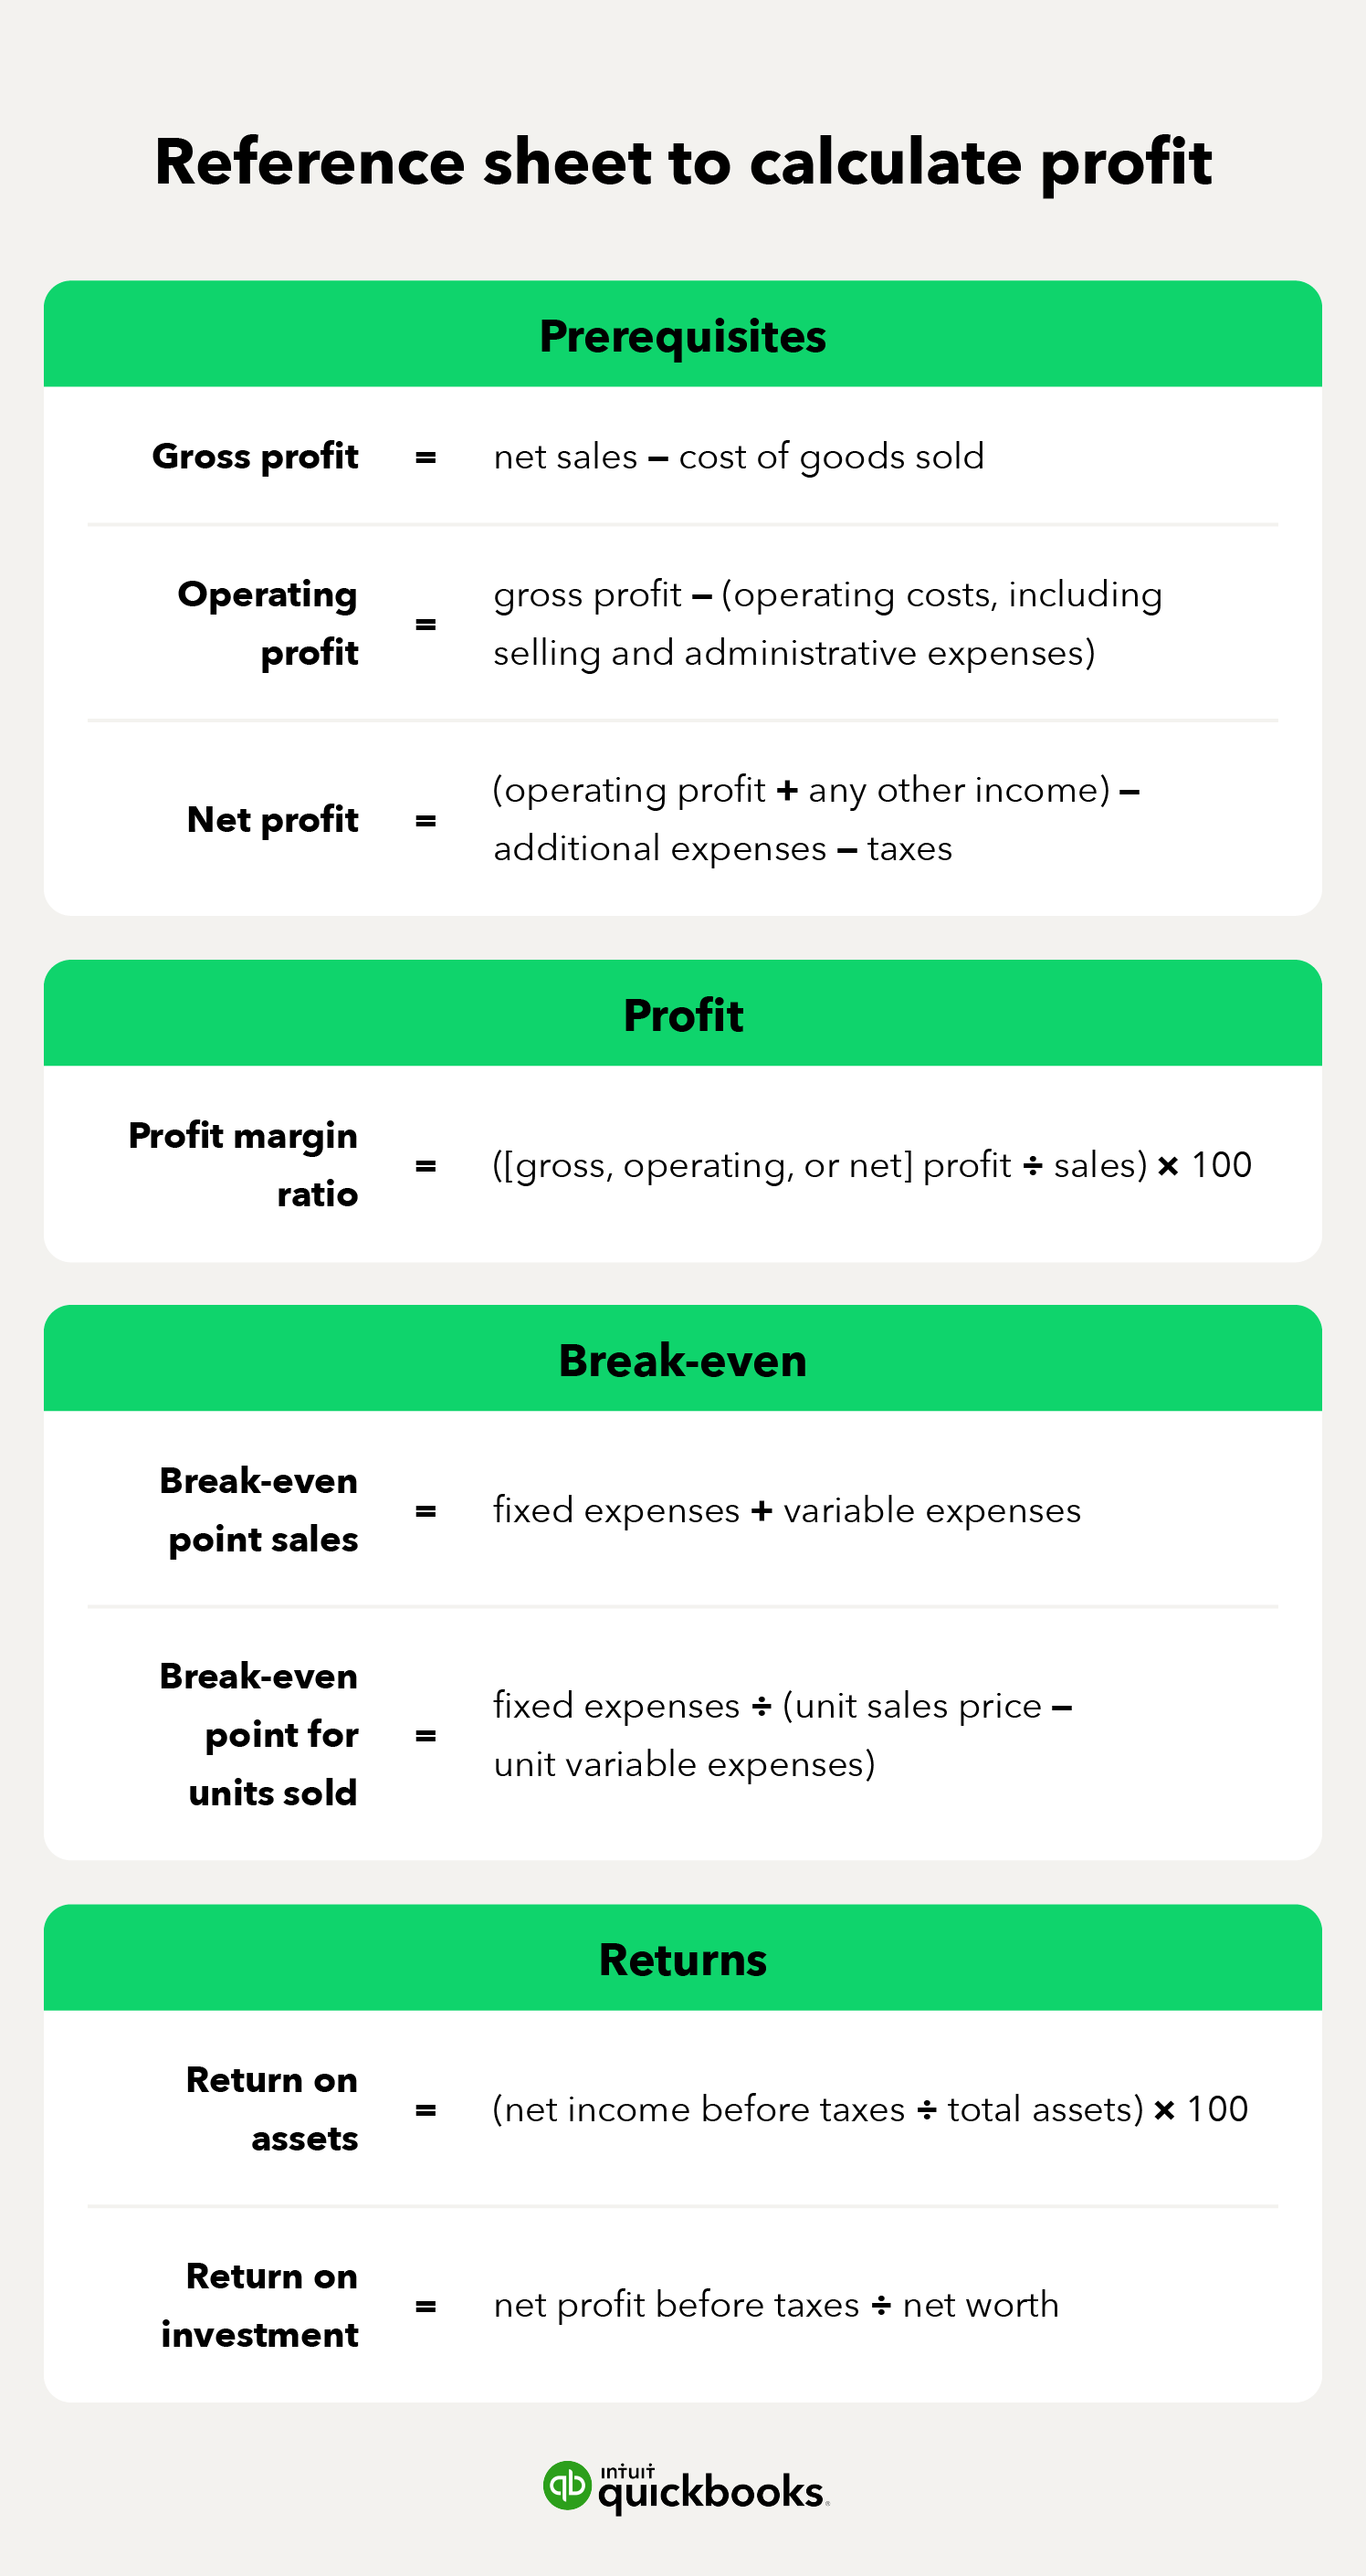
Broadly speaking, there are three key ways to determine whether you’re a profitable business: margin or profitability ratios; break-even analyses; and return on asset assessments.
In this article, we’ll provide you with a breakdown of everything you need to know to run an analysis of your financial profitability and how to measure the profitability of a company. The financial ratios and figures that included will, not only, provide you with an accurate measure of profitability, but will also help predict future profitability.