

Small business employment holds steady in Q2-2026
Simple, smart accounting software - no commitment, cancel anytime

Get the latest hiring and employment data insights for small businesses in the UK, the US and Canada by following the links below:
U.K. Index | U.S. Index | Canada Index | About the Index | Methodology
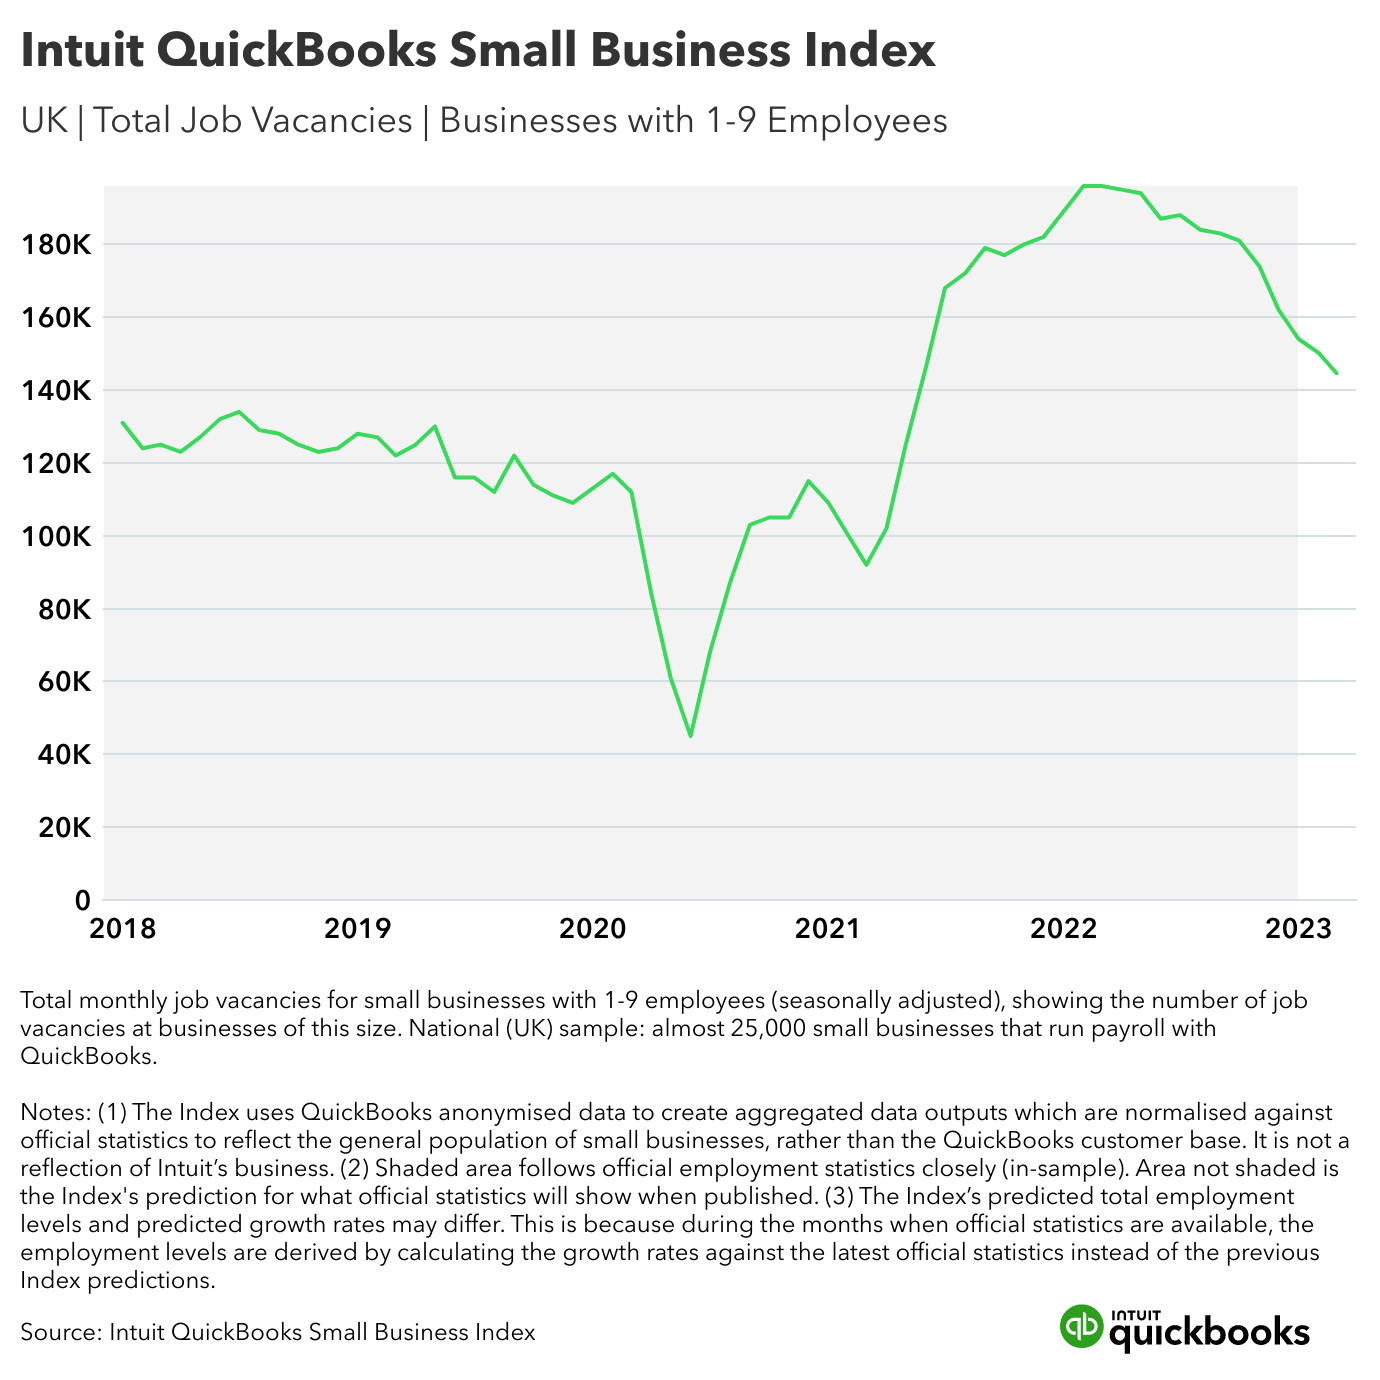
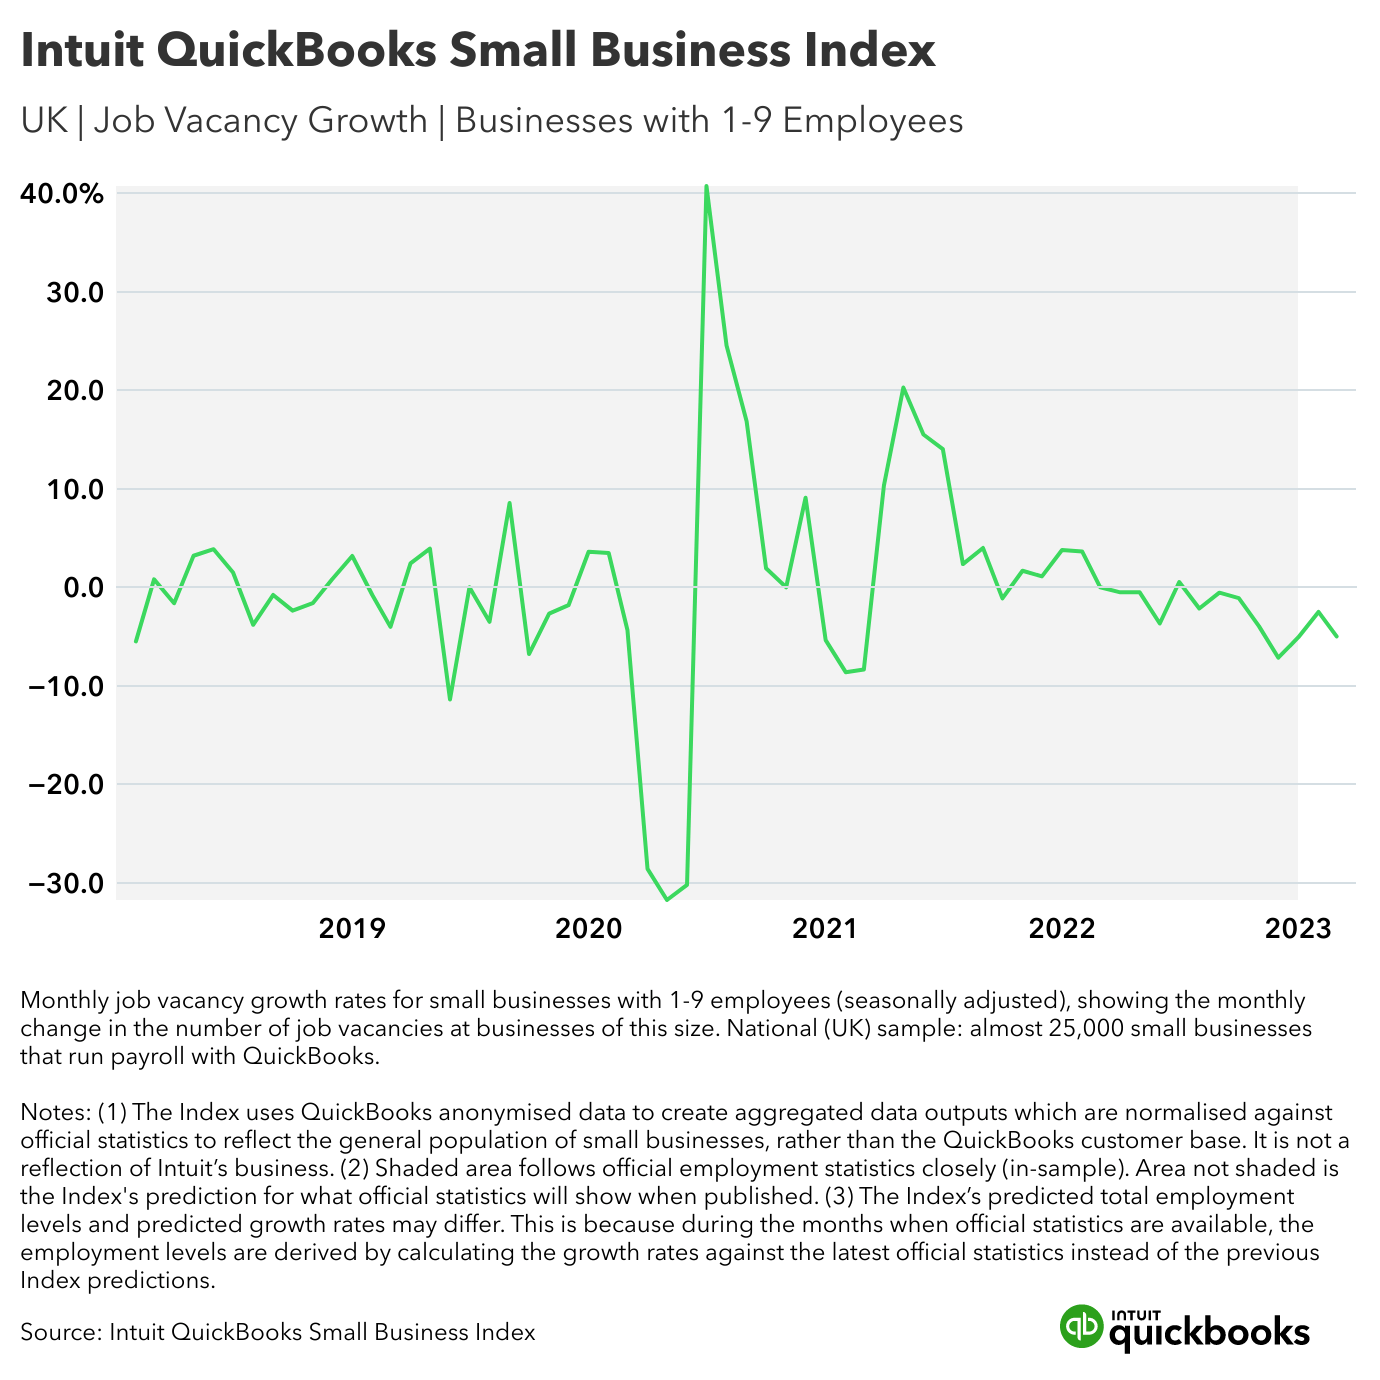
In the UK in March, small businesses with one to nine employees had 7,400 fewer job vacancies compared to the previous official benchmark of 152,000 in February’s Vacancy Survey, published by the Office for National Statistics. That’s a monthly decrease of -4.98% to 144,600 job vacancies — a larger decrease than in February, when employment dropped by -2.5%.
Sectors with the largest decreases in small business job vacancies were:
Arts, entertainment, and recreation (SIC R) with a drop of -11.43% to 4,800 job vacancies
Construction (SIC F) with a drop of -9.17% to 900 job vacancies
Transport and storage (SIC H) with a drop of -7.35% to 9,600 job vacancies
Sectors with the smallest decreases in small business job vacancies were:
Education (SIC P) with a drop of -0.65% to 15,400 job vacancies
Health care and social work (SIC Q) with a drop of -0.96% to 9,700 job vacancies
Finance and insurance (SIC K) with a drop of -1.02% to 6,700 job vacancies
Regionally, Northern Ireland had the largest decrease in the UK, with a drop of -9.54% to 2,100 small business job vacancies. England had the smallest decrease, down by -3.26% to 130,600 job vacancies.
“It [is] even more essential to monitor the small business statistics closely.”
Ufuk Akcigit, the Arnold C. Harberger Professor of Economics at the University of Chicago, said: “Inflation remains high in the UK and therefore the Bank of England hiked the interest rate again in March 2023. Small businesses are the first to be affected by difficult macroeconomic conditions.
“The Intuit QuickBooks Small Business Index shows that the UK economy had a -4.98% decline in vacancies compared to the previous month, which corresponds to 7,400 less vacancies among small businesses with at most nine workers. While the decline was observed in every sector, the arts, entertainment, and recreation sector experienced the sharpest drop by -11.4%, which could be a sign that consumers are spending less on discretionary purchases. The education sector observed the mildest decline by -0.65%. The negative trends make it even more essential to monitor the small business statistics closely, as small businesses are early indicators of aggregate economic activity in the UK.”
Get all the details from the interactive Small Business Index dashboard.
Media contact details for QuickBooks in the UK can be found here on the QuickBooks UK website.
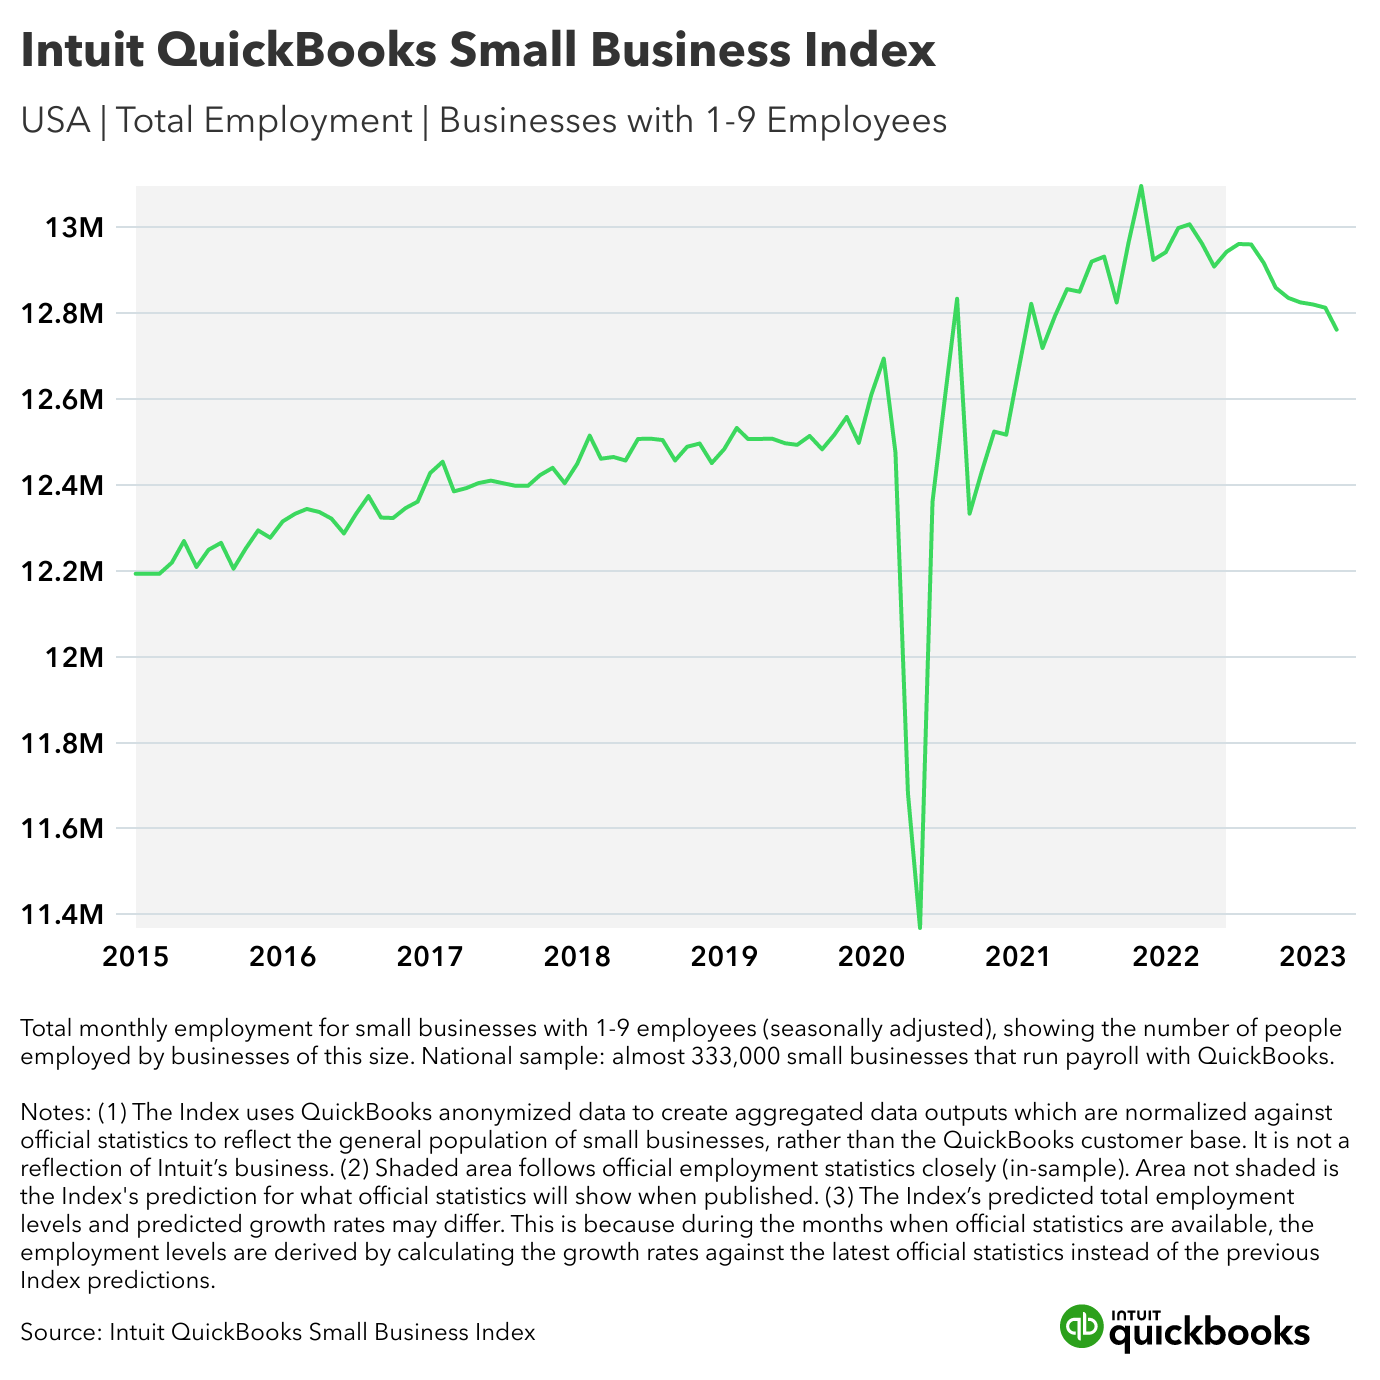
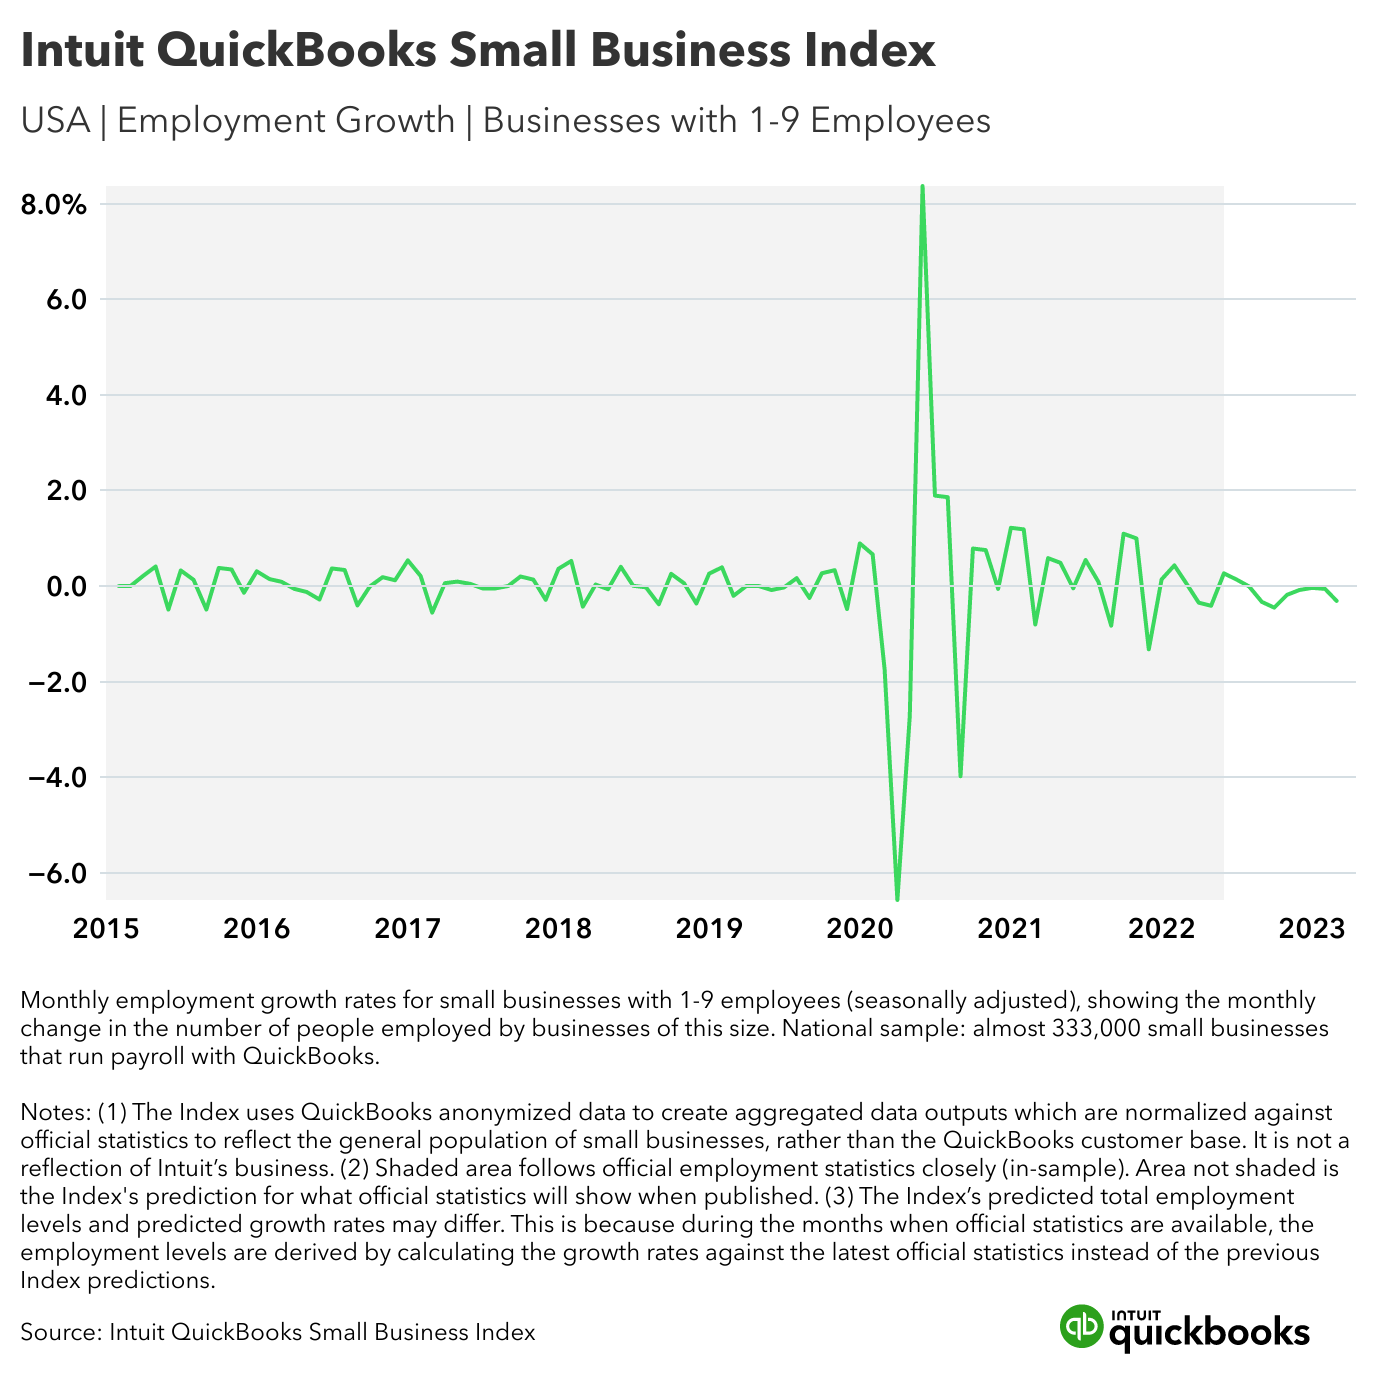
In the US in March, small businesses with one to nine employees employed 39,600 fewer people nationally compared to the previous month. That’s a monthly decrease of -0.31% to 12,773,100 jobs — a larger decrease than in February, when employment dropped by -0.06%.
Sectors with the largest decreases in small business employment were:
Information (NAICS 51) with a drop of -0.79% to 285,400 jobs
Construction (NAICS 23) with a drop of -0.78% to 750,400 jobs
Leisure and hospitality (NAICS 71-72) with a drop of -0.78% to 1,510,200 jobs
Sectors with the smallest decreases in small business employment were:
Utilities (NAICS 22) with a drop of -0.22% to 658,800 jobs
Natural resources and mining (NAICS 11; 21) with a drop of - 0.23% to 180,000 jobs
Retail (NAICS 44-45) with a drop of -0.28% to 1,523,900 jobs
Regionally, the Southwest (Arizona, New Mexico, Oklahoma, Texas) had the largest decrease in small business employment, with a drop of -0.67% to 1,566,900 jobs. The Rocky Mountain region (Colorado, Idaho, Montana, Utah, Wyoming) had the smallest decrease, with employment down by just -0.03% to 500,700 jobs.
“Small business employment continues to hold above pre-pandemic levels.”
Ufuk Akcigit, the Arnold C. Harberger Professor of Economics at the University of Chicago, said: “Small businesses are most sensitive to macroeconomic conditions. The current high inflationary environment, coupled with rising interest rates is expected to have an adverse effect on small business activities, which could explain the drop in the Index in March from February.
“Parallel to this observation, in March 2023, the Intuit Quickbooks Small Business Index shows a -0.31% decline in small business employment, which corresponds to 39,600 job losses among businesses with at most 9 workers. The information sector experienced the sharpest decline by -0.79% and utilities observed the mildest decline by -0.22%. It’s also notable that leisure and hospitality was among the highest growth sectors last month, but is now among those experiencing the largest decrease in employment, which reflects the volatility we're seeing in other statistics.
“While small business employment continues to hold above pre-pandemic levels, it is essential to monitor the small business statistics closely to ensure their health during this unusual episode of economic and financial disturbances.”
Get all the details from the interactive Small Business Index dashboard.
Media contact details for QuickBooks in the US can be found here on the Intuit website.
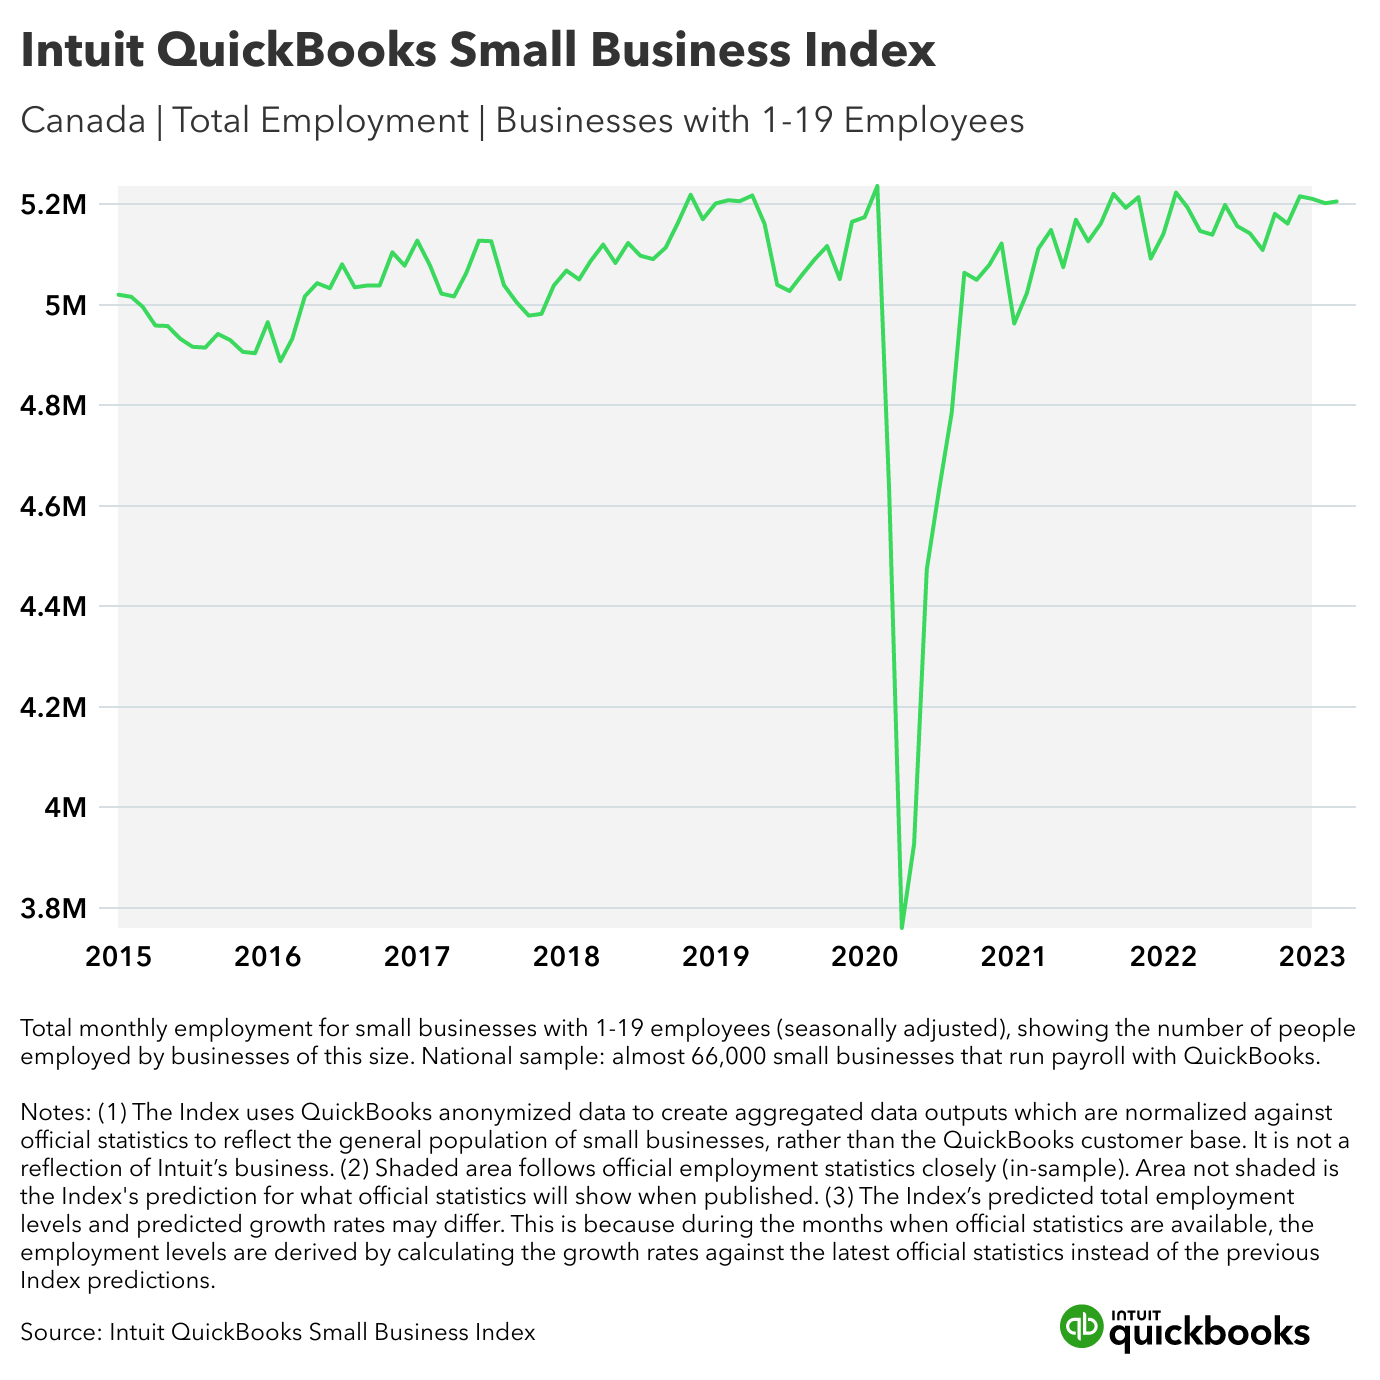
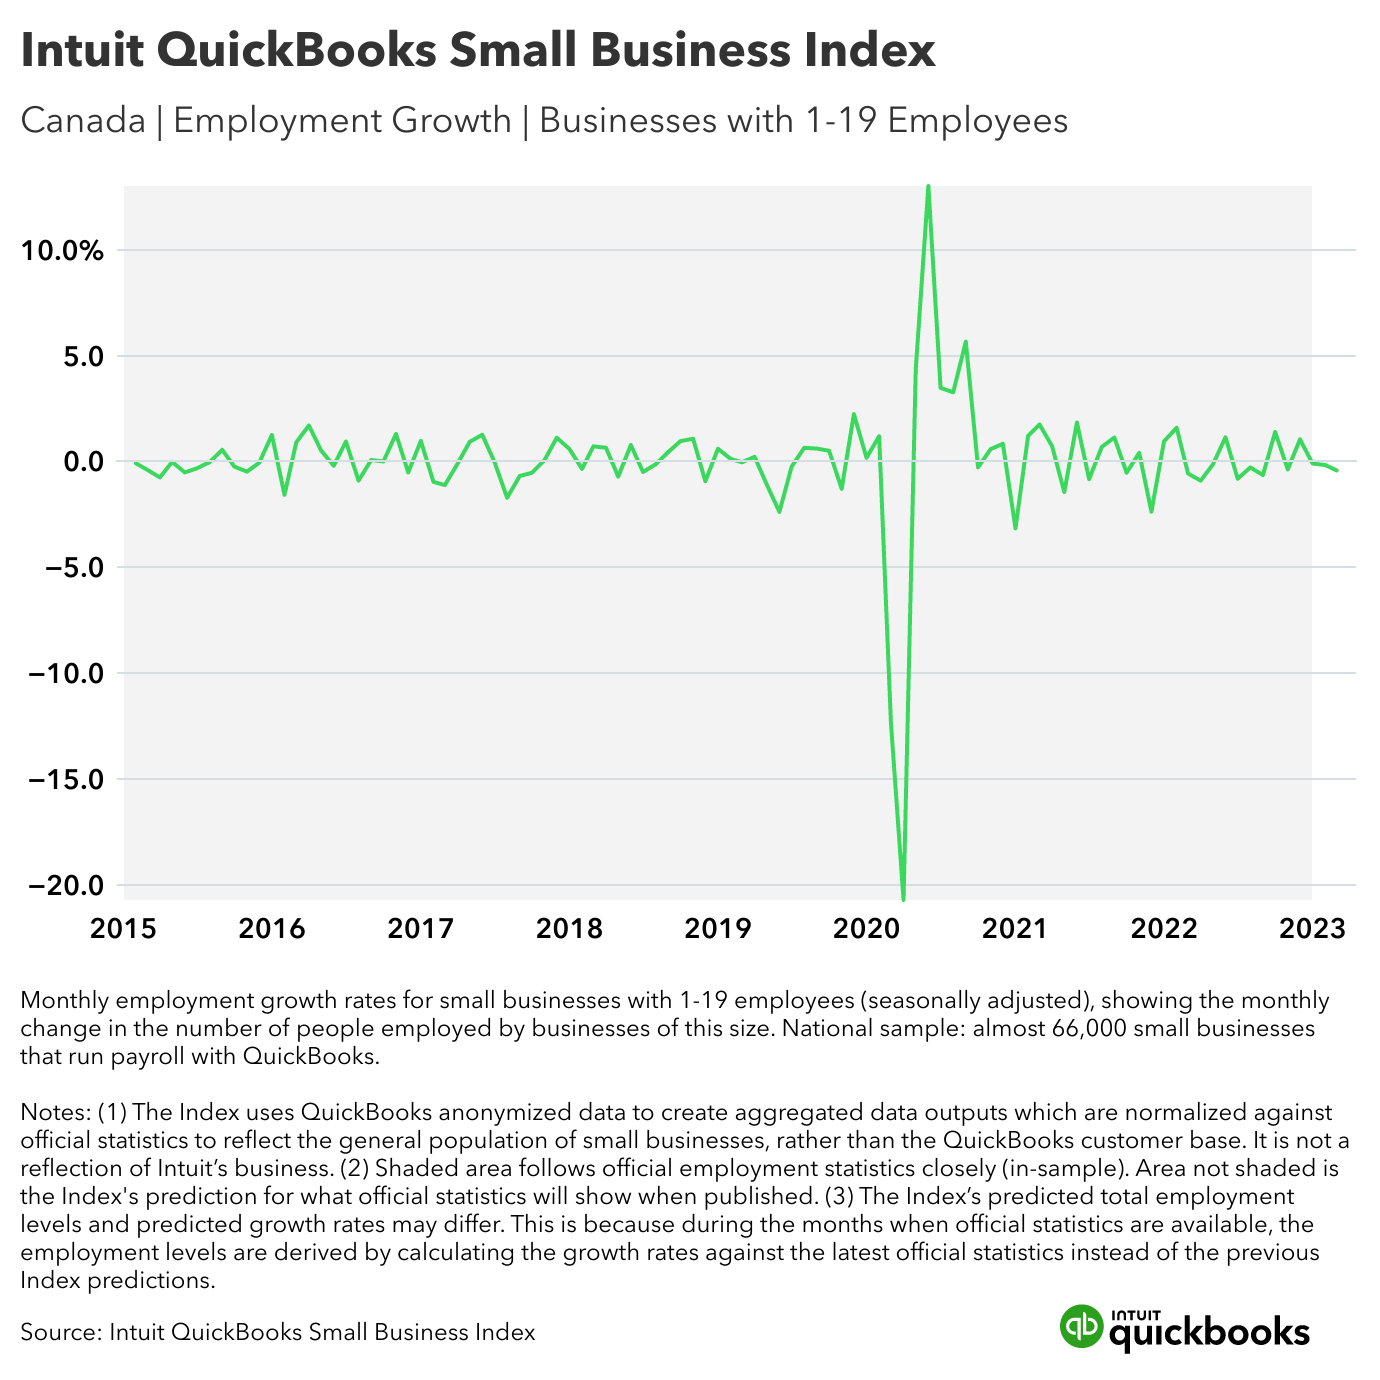
In Canada in March, small businesses with one to 19 employees employed 22,000 fewer people nationally compared to the previous official benchmark of 5,227,000 in February’s Labour Force Survey, published by Statistics Canada. That’s a monthly decrease of -0.42% to 5,205,000 jobs — a larger decrease than the Index predicted in February, when employment was predicted to drop by -0.17%.
Sectors with the largest decreases in small business employment were:
Accommodation and food services (NAICS 72) with a drop of -1.63% to 495,800 jobs
Natural resources and mining (NAICS 11; 21) with a drop of -1.39% to 136,900 jobs
Education (NAICS 61) with a drop of -0.93% to 168,700 jobs
One sector saw an increase in small business employment:
Health care and social assistance (NAICS 62) with an increase of 0.35% to 665,900 jobs
Regionally, the Atlantic region (Newfoundland and Labrador, Prince Edward Island, Nova Scotia, New Brunswick) had the smallest decrease in small business employment, down by -0.22% to 384,400 jobs. Québec had the largest decrease, down by -0.66% to 1,046,000 jobs.
“Small businesses are early indicators of aggregate economic activity in Canada.”
Ufuk Akcigit, the Arnold C. Harberger Professor of Economics at the University of Chicago, said: “Over the past year, the Canadian Central Bank raised the interest rate eight times in order to combat the high inflationary environment, which could explain the drop in the Index this month compared to the previous month. Small businesses always react to economic and financial disturbances first and therefore it is very important to keep a close eye on their near real-time statistics.
“In March 2023, the Intuit QuickBooks Small Business Index showed a -0.42% decline in employment, which corresponds to 22,000 job losses among businesses with at most 19 workers. Accommodation and food services experienced the sharpest decline by -1.63% — a significant change from last month when it was the fastest growing, which points to a shift away from discretionary spending such as dining out. Health care and social assistance showed a 0.35% increase in employment.
“The negative trends make it even more essential to monitor the small business statistics closely, as small businesses are early indicators of aggregate economic activity in Canada.”
Get all the details from the interactive Small Business Index dashboard.
Media contact details for QuickBooks in Canada can be found here on the Intuit website.
The Intuit QuickBooks Small Business Index is a timely new measure of small business employment and hiring in the UK, the US and Canada. The Index launched in March 2023 and is updated monthly. The Index uses purpose-built economic models to normalise anonymised QuickBooks data to reflect the general population of small businesses in each country; it is not a reflection of Intuit’s business. The Index was developed in collaboration with leading economist Professor Ufuk Akcigit and an international team of researchers and academics.
The Intuit QuickBooks Small Business Index creates aggregated data outputs from a sample of anonymised QuickBooks Online Payroll customer records which are calibrated using statistical methods to create modeled results which better reflect the general population of small businesses in each country, as represented by published official statistics. Statistical adjustment ensures the Index truly reflects employment and job vacancy changes rather than trends in the QuickBooks customer base. Get the full methodology here.
Total and monthly changes in employment and job vacancies have been rounded to the nearest hundred. Monthly changes and growth rates are calculated before total employment or job vacancy values are rounded. Rates have been rounded to the nearest hundredth.
The Index’s data insights are seasonally adjusted to limit the effect of seasonal patterns in employment and hiring throughout the year, which lead to regular fluctuations in workforce growth and contraction.
Employment growth(t) = [Employment(t)-Employment(t-1)]/[0.5*Employment(t)+0.5*Employment(t-1)]
The Index produces a monthly prediction of employment growth rates by country, region and sector. In order to translate these growth rates into the number of jobs/vacancies gained or lost, the growth rates are multiplied by the prior month’s predicted employment levels, except during the months when official statistics are published. During those months, the latest official employment levels that have been reported are used in the calculation instead of the Index’s prior month’s predicted employment levels. Official statistics are published at different frequencies depending on the country.
The Index uses data going back to January 2018 in the UK and to January 2015 in the US and Canada. Published at the earliest opportunity every month, the Index shows the number of job vacancies at small businesses (in the UK) or the number of people employed by small businesses (in the US and Canada) in the previous month and how that number has changed since the month before. The Index helps to eliminate almost all of the time lags in official statistics by providing estimated projections of what those statistics will ultimately show when they are published.
The total sample across all three countries is around 424,000 small businesses. The UK sample is almost 25,000 small businesses. The US sample is almost 333,000 small businesses. The Canadian sample is almost 66,000 small businesses. The minimum sample sizes for regions or sectors to be included in the Index are 200 small businesses in the UK, 1,000 small businesses in the US and 800 small businesses in Canada.
In the UK and US, the Index targets the populations of small businesses with one to nine employees. In Canada, the target population is small businesses with one to 19 employees. The differences ensure the Index’s data insights are consistent with official statistics in each country, which are used for benchmarking during the calibration process. Timely data insights for these populations of small businesses are particularly valuable since most datasets fail to cover this portion of the economy well. Please note: Unlike in the US and Canada, the UK Index uses job vacancy data for calibration rather than employment data because official employment statistics are not currently available for small businesses on a monthly basis.
External data sources used alongside the samples of anonymized QuickBooks Online Payroll customer data include:
UK Office for National Statistics job vacancy data
US Bureau of Labor Statistics Business Employment Dynamics (BED) and Job Openings and Labor Turnover Survey (JOLTS)
US Bureau of Economic Analysis regions
Statistics Canada Labour Force Survey and regions
UK data insights are currently available at the country level (England, Scotland, Wales, Northern Ireland) — not regionally within countries.
USA data insights are divided into Bureau of Economic Analysis (BEA) regions
Canada data insights are divided into Statistics Canada regions
USA and Canada data insights are available by North American Industry Classification System (NAICS) sectors
UK data insights are available by UK Standard Industrial Classification of Economic Activities (SIC) sectors (known as “sections”).
Disclaimer
This content is for information purposes only and should not be considered legal, accounting or tax advice, or a substitute for obtaining such advice specific to your business. Additional information and exceptions may apply. Applicable laws may vary by region, state or locality. No assurance is given that the information is comprehensive in its coverage or that it is suitable in dealing with a customer’s particular situation. Intuit does not have any responsibility for updating or revising any information presented herein. Accordingly, the information provided should not be relied upon as a substitute for independent research. Intuit does not warrant that the material contained herein will continue to be accurate nor that it is completely free of errors when published. Readers should verify statements before relying on them.
We provide third-party links as a convenience and for informational purposes only. Intuit does not endorse or approve these products and services, or the opinions of these corporations or organizations or individuals. Intuit accepts no responsibility for the accuracy, legality, or content on these sites.
Share:
Subscribe to get our latest insights, promotions, and product releases straight to your inbox.
9.00am - 5.30pm Monday - Friday

