

Cloud accounting
The future of strategic client advisory – Intuit Intelligence has arrived
Simple, smart accounting software - no commitment, cancel anytime

Get the latest hiring and employment data insights for small businesses in the UK, the US and Canada by following the links below:
U.K. Index | U.S. Index | Canada Index | About the Index | Methodology
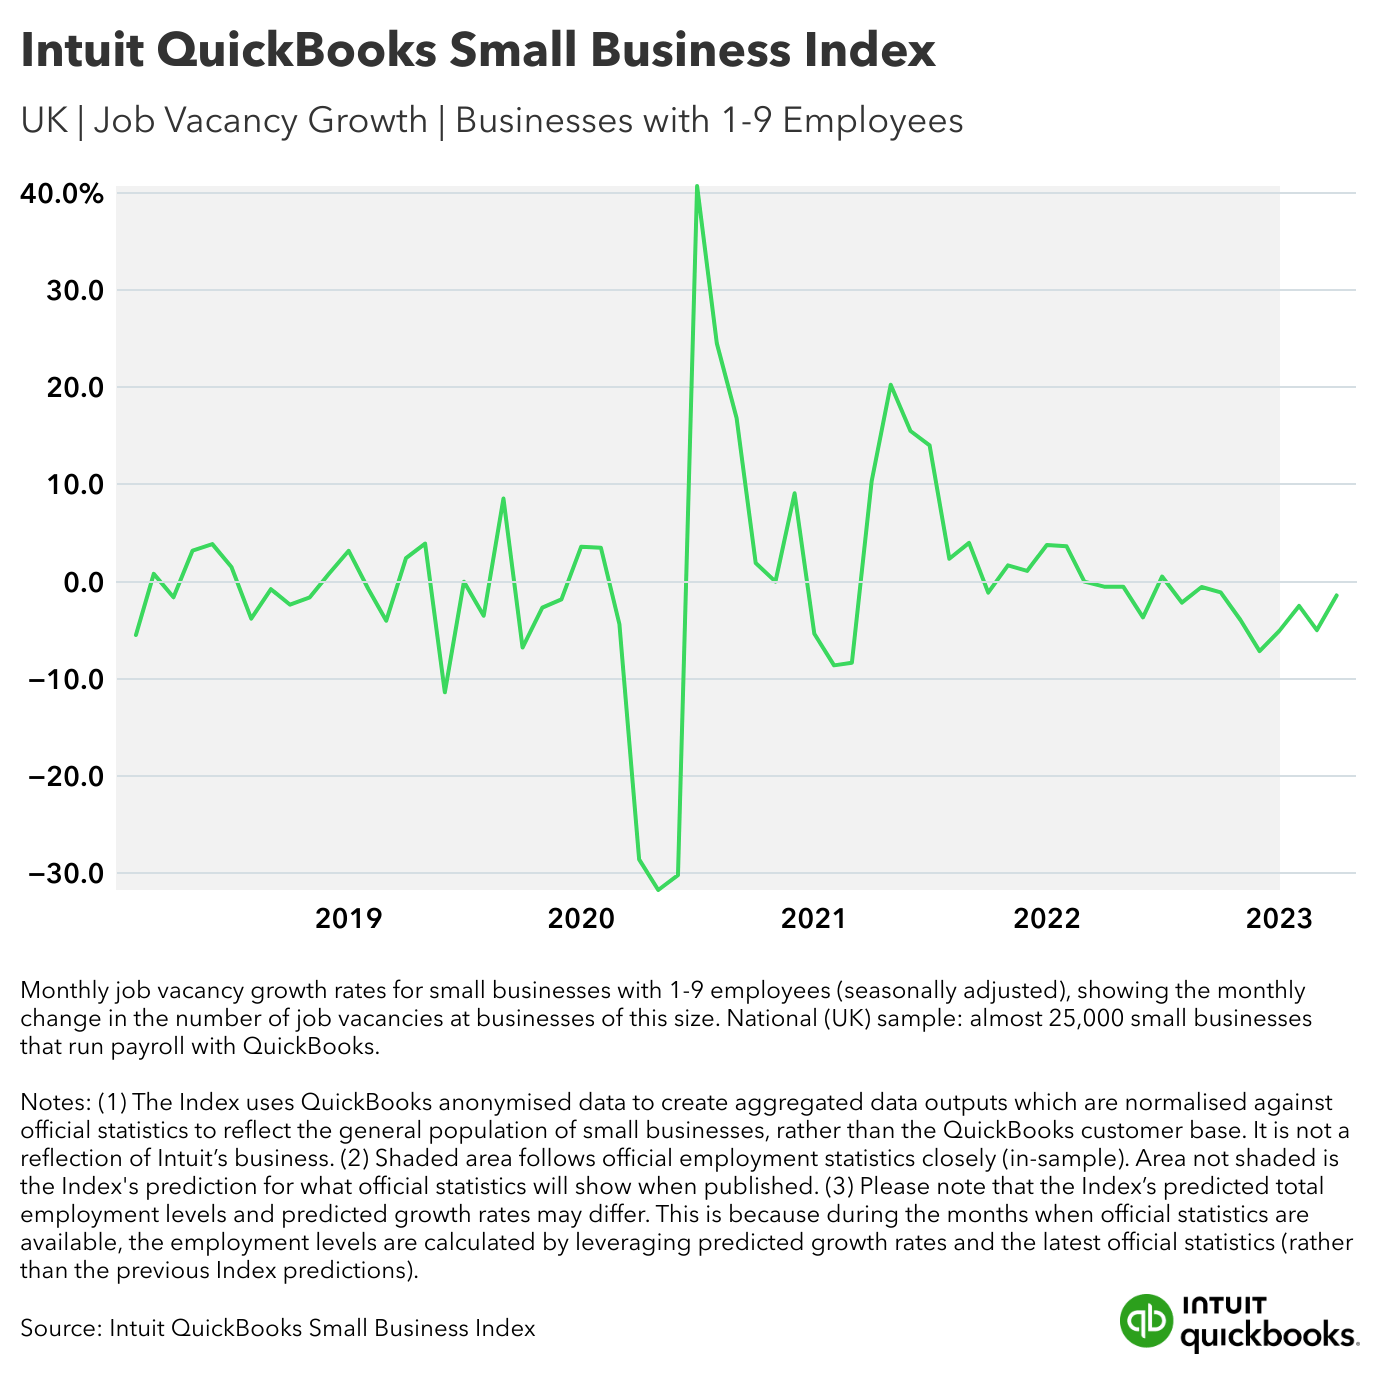
In the UK in April, small businesses with one to nine employees had 2,100 fewer job vacancies compared to the previous official benchmark of 150,000 in March’s Vacancy Survey, published by the Office for National Statistics.* That’s a monthly decrease of -1.42% to 147,900 job vacancies — a smaller decrease than in March, when the Index predicted a drop of -4.98%.
The number of small business job vacancies fell in every sector. Sectors with the largest decreases were:
Information and communication (SIC J) — such as book publishers, newspapers, and journals — with a drop of -3.12% to 5,400 job vacancies
Wholesale and retail trades (SIC G) — such as textile wholesalers, home furnishing stores, and hardware stores — with a drop of -2.90% to 18,700 job vacancies
Administrative and support service activities (SIC N) — such as travel agencies, cleaning services, and landscape companies — with a drop of -2.54% to 1,600 job vacancies
Sectors with the smallest decreases in small business job vacancies were:
Real estate (SIC L) — including real estate agencies and management services — with a drop of -0.48% to 5,800 job vacancies
Construction (SIC F) — including roofing companies and demolition services — with a drop of -1.07% to 900 job vacancies
Transport and storage (SIC H) — such as taxi companies and railway support services — with a drop of -1.32% to 10,200 job vacancies.
Regionally, Scotland had the largest decrease in the UK, with a drop of -2.58% to 9,000 small business job vacancies. Wales had the smallest decrease, down by -0.85% to 5,200 job vacancies.
“While the job vacancies are still above the pre-pandemic levels, they have lost most of the gain that was generated between the dip in June 2020 and the peak in February 2022.”
Ufuk Akcigit, the Arnold C. Harberger Professor of Economics at the University of Chicago, said: “The UK economy has been struggling with various macroeconomic problems, including the inflationary pressures due to high energy and food prices. The chief economist of the Bank of England has also raised concerns about secondary effects such as wage increases, hence the inflation rate has been higher and the disinflationary process has been slower than the US and Canada. Consistent with these macro-level observations, the UK vacancy numbers have experienced a significant drop of -1.42% in April, a continued decline since February 2022.
“While the job vacancies are still above the pre-pandemic levels, they have lost most of the gain that was generated between the dip in June 2020 and the peak in February 2022. Since job vacancies are correlated with hunger for economic activity, these negative numbers can potentially be interpreted as a contraction in small business activities. The decline in April was led by Scotland (-2.58%) at the regional level and “Information and Communication” (-3.12%) at the sectoral levels. Unfortunately the decline was across all the regions and sectors with heterogeneous magnitudes. The mildest declines were observed in Wales (-0.85%) and “Real Estate” (-0.48%).
“The expectations about the near future of the UK economy are still challenging and the smallest businesses are the first ones to be affected by the adverse conditions. Therefore, it makes it even more essential to monitor small business activities in the UK and Intuit QuickBooks Small Business Index can provide valuable insights during these turbulent times.”
Get all the details from the interactive Small Business Index dashboard.
Media contact details for QuickBooks in the UK can be found here on the QuickBooks UK website.
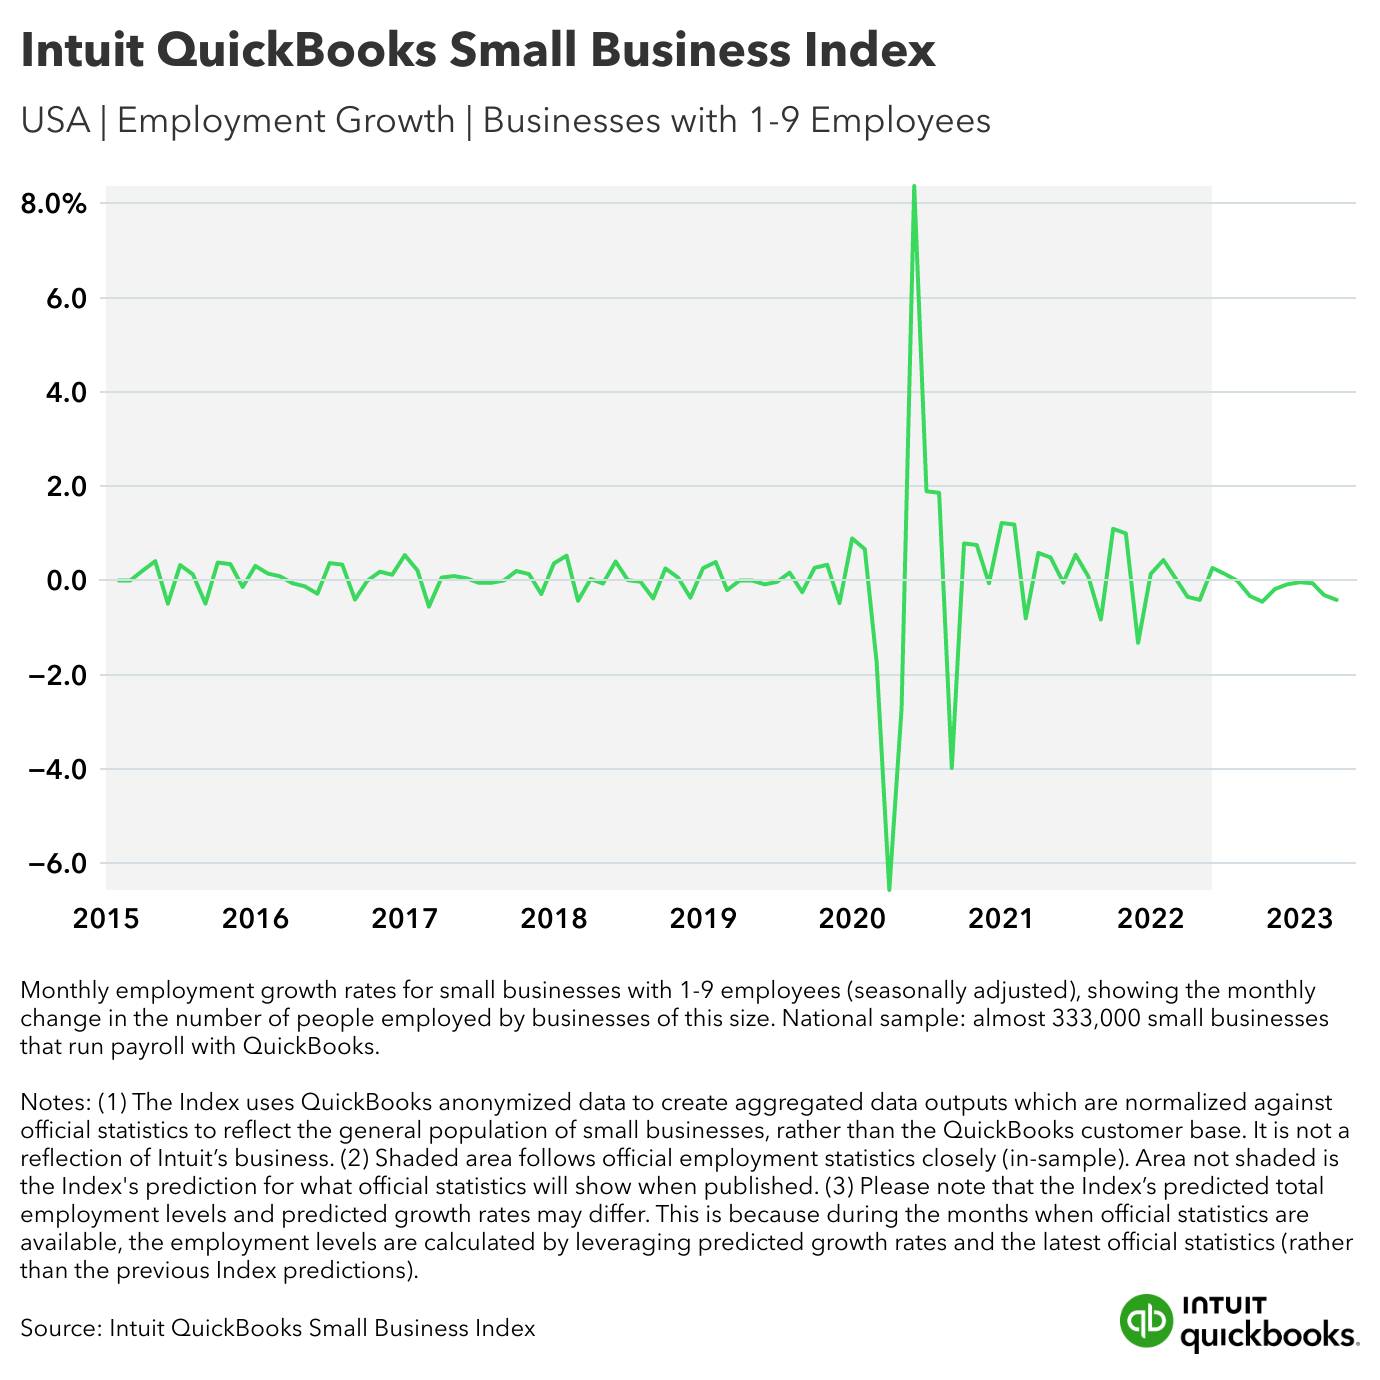
In the US in April, small businesses with one to nine employees saw monthly employment decrease by -0.41% to 12,883,900 jobs.* This means small businesses now employ 53,300 fewer people nationally compared to the previous month. This is a larger decrease than in March, when the Index reported a drop of -0.31%.
Small business employment dropped in every sector. Sectors with the largest decreases were:
Information (NAICS 51) — such as radio networks, newspapers, and book publishers — with a drop of -0.95% to 294,400 jobs
Finance and real estate (NAICS 52-53) — such as credit unions and property management companies — with a drop of -0.70% to 844,000 jobs
Transport and warehousing (NAICS 48-49) — such as taxi services, school bus companies, and storage companies — with a drop of -0.65% to 52,700 jobs
Sectors with the smallest decreases in small business employment were:
Utilities (NAICS 22) — including power, irrigation, and air conditioning supply — with a drop of -0.10% to 645,200 jobs
Agriculture, natural resources, and mining (NAICS 11; 21) — such as orchards, farms, and drilling contractors — with a drop of -0.22% to 178,700 jobs
Education and health services (NAICS 61-62) — such as exam preparation services, driving schools, and physician and dental practices — with a drop of -0.26% to 2,332,500 jobs
Regionally, the Rocky Mountain region (Colorado, Idaho, Montana, Utah, Wyoming) had the largest decrease in small business employment, with a drop of -0.45% to 499,100 jobs — reversing course from March when the Index predicted the region having the smallest decrease. The Great Lakes region (Illinois, Indiana, Michigan, Ohio, Wisconsin) had the smallest decrease, with employment down by -0.13% to 1,883,400 jobs.
New England (Connecticut, Maine, Massachusetts, New Hampshire, Rhode Island, Vermont) was the only region that had an increase in small business employment, with an uptick of 0.16% to 639,000 jobs.
“While US small businesses experienced a surge between May 2020 and Nov 2021, their employment numbers have been decreasing steadily since then and are now almost reaching pre-pandemic levels.”
Ufuk Akcigit, the Arnold C. Harberger Professor of Economics at the University of Chicago, said: “The US economy is still experiencing above-target (2% in the long-run) inflation and tightening of monetary policy. These adverse macroeconomic conditions may have negative consequences on many small businesses, especially on the smallest ones. The Intuit QuickBooks Small Business Index, which keeps track of the economic activities of small businesses with one to nine workers confirms these probable conclusions. The April numbers are indicative of a continued decline of -0.41% in employment (as compared to -0.31% in March) of all US businesses with at most nine workers.
“The labour market’s response has been heterogeneous across the US regions and sectors. While the Rocky Mountain region has witnessed the sharpest decline, by -0.45%, New England has been the only region that experienced positive growth of 0.16% in employment. Employment in “Information” and “Financial Activities” sectors has declined by -0.95% and -0.70%, respectively. The lowest sectoral drop happened in “Utilities” by -0.10%.
“While US small businesses experienced a surge between May 2020 and Nov 2021, their employment numbers have been decreasing steadily since then and are now almost reaching pre-pandemic levels. Given the Fed’s recent interest rate increase of 25 basis points, the decline might not necessarily end soon. These conditions have a significant impact on small businesses, shifting the economic activity away from them. The continued decline of small business activities over the past year should be monitored closely through timely indicators such as the Intuit QuickBooks Small Business Index.”
Get all the details from the interactive Small Business Index dashboard.
Media contact details for QuickBooks in the US can be found here on the Intuit website.
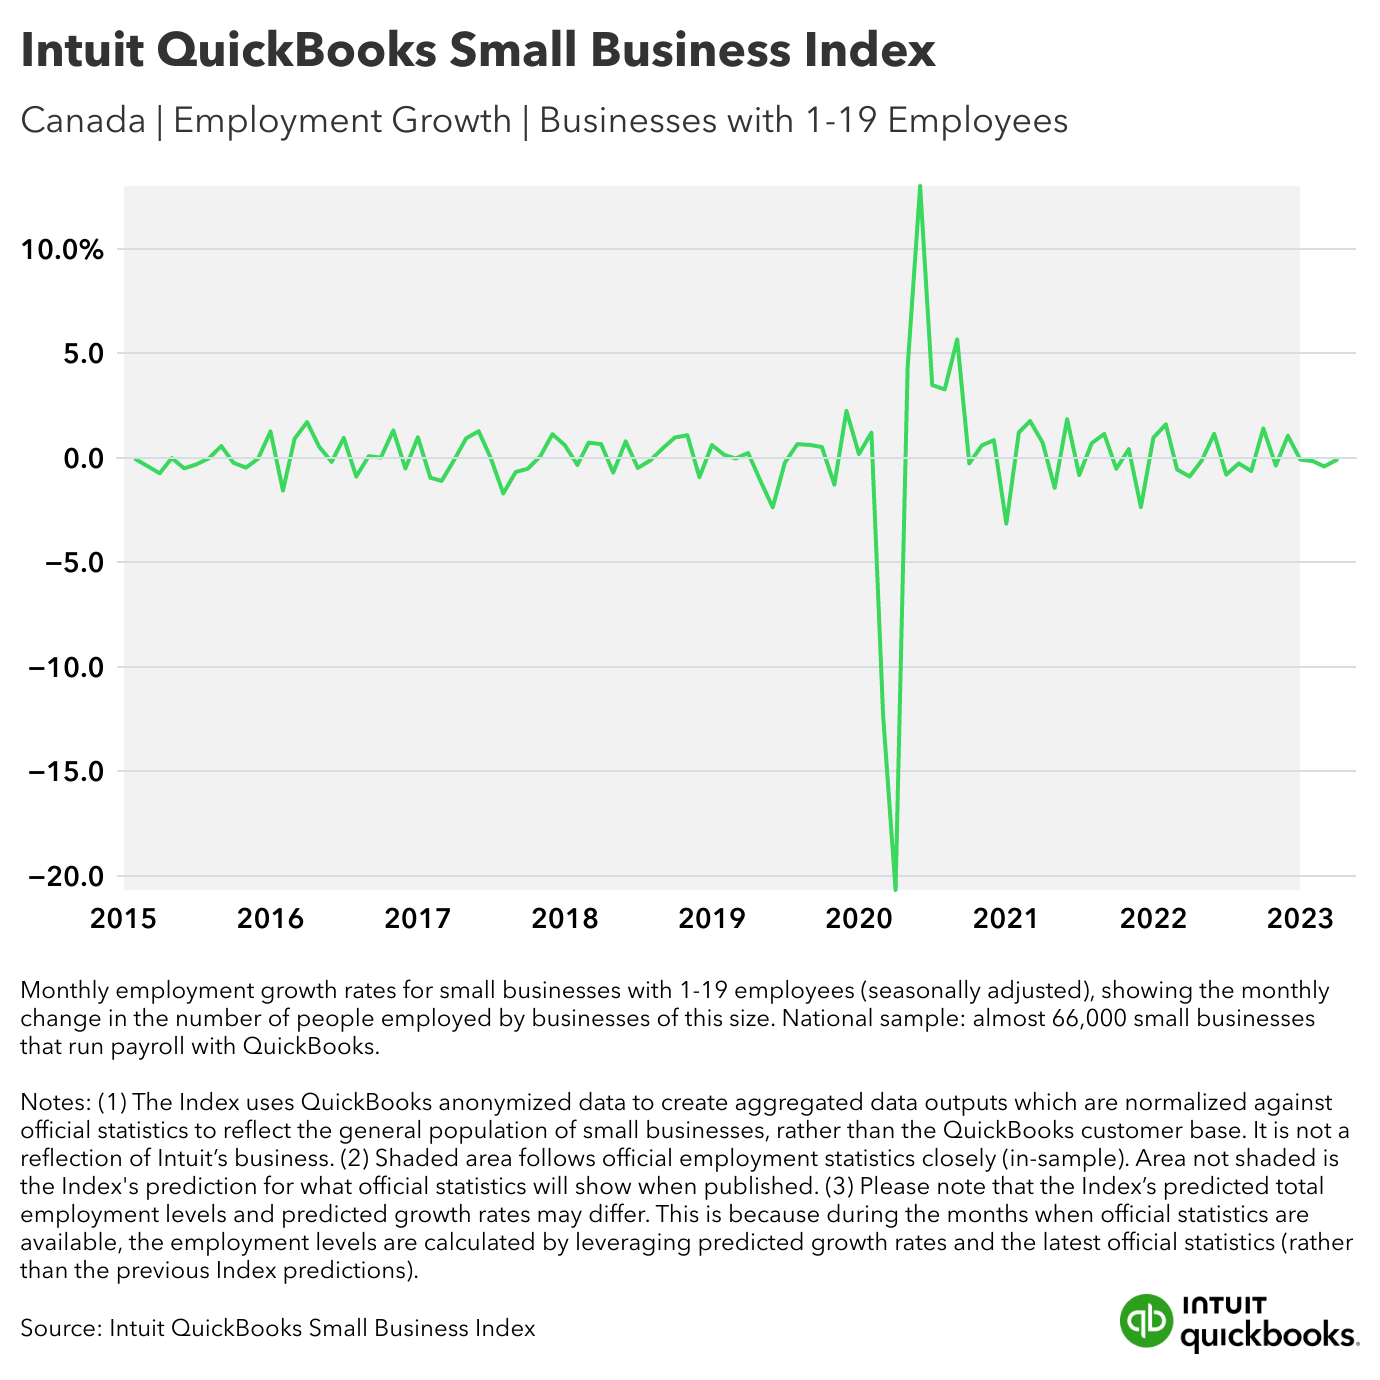
In Canada in April, small businesses with one to 19 employees employed 5,700 fewer people nationally compared to the previous official benchmark of 5,303,300 in March’s Labour Force Survey, published by Statistics Canada.* That’s a monthly decrease of -0.11% to 5,297,600 jobs — a smaller decrease than in March, when the Index predicted a drop of -0.42%.
Small business employment dropped in five sectors. Sectors with the largest decreases were:
Utilities (NAICS 22) — including power, irrigation, and air conditioning supply — with a drop of -0.35% to 29,000 jobs
Construction (NAICS 23) — including roofing, siding, and drywall contractors — with a drop of -0.34% to 560,000 jobs
Agriculture, natural resources, and mining (NAICS 11; 21) — such as farms, orchards, and drilling contractors — with a drop of -0.17% to 130,600 jobs
But in eight sectors, small business employment went up. Sectors with the largest increases were:
Accommodation and food services (NAICS 72) — including bed and breakfasts, catering services, and restaurants — with an increase of 0.81% to 505,800 jobs
Information; arts and recreation (NAICS 51; 71) — such as radio stations, movie theatres, museums, and gyms — with an increase of 0.47% to 209,500 jobs
Education (NAICS 61) — such as exam preparation services, driving schools, and beauty schools — with an increase of 0.45% to 180,700 jobs
Regionally, the Prairies (Manitoba, Saskatchewan, Alberta) had the largest decrease in small business employment, down by -0.17% to 1,056,600 jobs. British Columbia had the smallest decrease with a decline of -0.06% to 817,200 jobs.
Québec had the largest increase in small business employment, with an uptick of 0.63% to 1,053,000 jobs.
“Even though there are some expectations about the loosening of monetary policy in Canada in the near future, the current state of the economy is still generating a contractionary environment for small businesses.”
Ufuk Akcigit, the Arnold C. Harberger Professor of Economics at the University of Chicago, said: “The inflation rate has declined in recent months in Canada, but it is still above the long-run target level of 2%. Bank of Canada kept its interest rate steady at 4.5% in April. Even though there are some expectations about the loosening of monetary policy in Canada in the near future, the current state of the economy is still generating a contractionary environment for small businesses.
“In April, firms with at most 19 workers experienced a -0.11% decline in employment, which was led by “Utilities” (-0.35%) at the sectoral level and by Prairies (-0.17%) at the regional level. Some sectors and regions, on the other hand, experienced some positive growth. In particular, small business employment in Québec increased by 0.63%. At the sectoral level, “Accommodation and Food Services” experienced the fastest increase by 0.81%.
“While a tight monetary policy's goal is to cool down the overall economy, it should be noted that these conditions have a side effect of disproportionate pressure on the smallest businesses. This might have an additional redistributive effect between small and large businesses, which should be monitored closely by more focused labour market indicators, such as the Intuit QuickBooks Small Business Index.”
Get all the details from the interactive Small Business Index dashboard.
Media contact details for QuickBooks in Canada can be found here on the Intuit website.
The Intuit QuickBooks Small Business Index is a timely new measure of small business employment and hiring in the UK, the US and Canada. The Index launched in March 2023 and is updated monthly. The Index uses purpose-built economic models to normalise anonymised QuickBooks data to reflect the general population of small businesses in each country; it is not a reflection of Intuit’s business. The Index was developed in collaboration with leading economist Professor Ufuk Akcigit and an international team of researchers and academics.
The Intuit QuickBooks Small Business Index creates aggregated data outputs from a sample of anonymised QuickBooks Online Payroll customer records which are calibrated using statistical methods to create modelled results which better reflect the general population of small businesses in each country, as represented by published official statistics. Statistical adjustment ensures the Index truly reflects employment and job vacancy changes rather than trends in the QuickBooks customer base.
Read more or download the full methodology.
Total and monthly changes in employment and job vacancies have been rounded to the nearest hundred. Monthly changes and growth rates are calculated before total employment or job vacancy values are rounded. Rates have been rounded to the nearest hundredth.
The Index’s data insights are seasonally adjusted to limit the effect of seasonal patterns in employment and hiring throughout the year, which lead to regular fluctuations in workforce growth and contraction.
Employment growth(t) = [Employment(t)-Employment(t-1)]/[0.5*Employment(t)+0.5*Employment(t-1)]
The Index produces a monthly prediction of employment growth rates by country, region, and sector. In order to translate these growth rates into the number of jobs/vacancies gained or lost, the growth rates are multiplied by the prior month’s predicted employment levels, except during the months when official statistics are published. During those months, the latest official employment levels that have been reported are used in the calculation instead of the Index’s prior month’s predicted employment levels. As a result, the Index’s predicted total employment levels may at times differ from the predicted growth rates. Official statistics are published at different frequencies depending on the country ranging from monthly to quarterly.
The Index uses data going back to January 2018 in the UK and to January 2015 in the US and Canada. Published at the earliest opportunity every month, the Index shows the number of job vacancies at small businesses (in the UK) or the number of people employed by small businesses (in the US and Canada) in the previous month and how that number has changed since the month before. The Index helps to eliminate almost all of the time lags in official statistics by providing estimated projections of what those statistics will ultimately show when they are published.
The total sample across all three countries is around 424,000 small businesses. The UK sample is almost 25,000 small businesses. The US sample is almost 333,000 small businesses. The Canadian sample is almost 66,000 small businesses. The minimum sample sizes for regions or sectors to be included in the Index are 200 small businesses in the UK, 1,000 small businesses in the US and 800 small businesses in Canada.
In the UK and US, the Index targets the populations of small businesses with one to nine employees. In Canada, the target population is small businesses with one to 19 employees. The differences ensure the Index’s data insights are consistent with official statistics in each country, which are used for benchmarking during the calibration process. Timely data insights for these populations of small businesses are particularly valuable since most datasets fail to cover this portion of the economy well. Please note: Unlike in the US and Canada, the UK Index uses job vacancy data for calibration rather than employment data because official employment statistics are not currently available for small businesses on a monthly basis.
External data sources used alongside the samples of anonymised QuickBooks Online Payroll customer data include:
UK Office for National Statistics job vacancy data
U.S. Bureau of Labor Statistics Business Employment Dynamics (BED) and Job Openings and Labor Turnover Survey (JOLTS)
U.S. Bureau of Economic Analysis regions
Statistics Canada Labour Force Survey and regions
In Canada, data insights are divided into Statistics Canada regions
In the UK, data insights are currently available at the country level (England, Scotland, Wales, Northern Ireland) — not regionally within countries
In the US, data insights are divided into Bureau of Economic Analysis (BEA) regions
In Canada and the US, data insights are available by North American Industry Classification System (NAICS) sectors
In the UK, data insights are available by UK Standard Industrial Classification of Economic Activities (SIC) sectors (known as “sections”)
Disclaimer
This content is for information purposes only and should not be considered legal, accounting or tax advice, or a substitute for obtaining professional advice specific to your business. Additional information and exceptions may apply. Applicable laws may vary by region, state or locality. No assurance is given that the information is comprehensive in its coverage or that it is suitable in dealing with a customer’s particular situation. Intuit does not have any responsibility for updating or revising any information presented herein. Accordingly, the information provided should not be relied upon as a substitute for independent research. Intuit does not warrant that the material contained herein will continue to be accurate nor that it is completely free of errors when published. Readers should verify statements before relying on them.
We may occasionally provide third-party links as a convenience and for informational purposes only. Intuit does not endorse or approve the views or opinions of any corporation or organisation or individual herein. Intuit accepts no responsibility for the accuracy, or legality, of third-party content.
Share:
Subscribe to get our latest insights, promotions, and product releases straight to your inbox.
9.00am - 5.30pm Monday - Friday

