Data Sources and Methodology
1. QuickBooks Online Payroll data
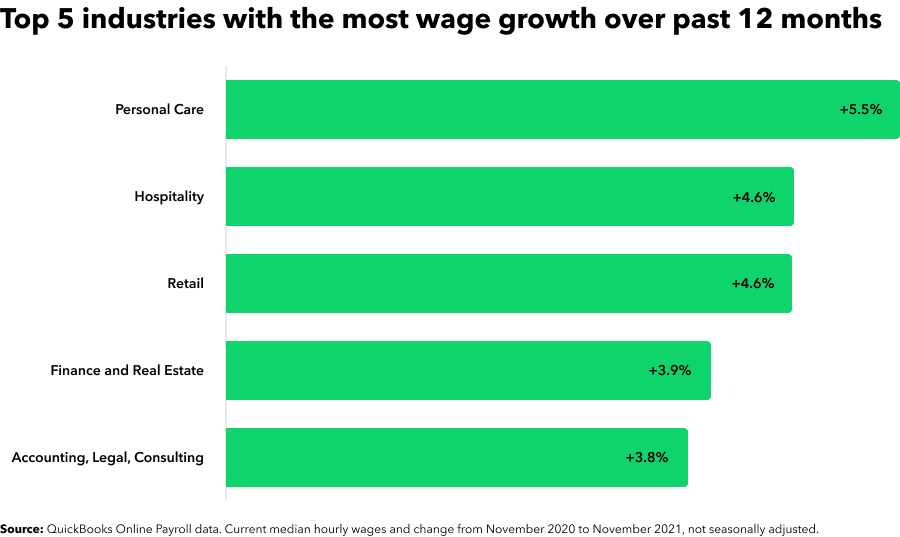
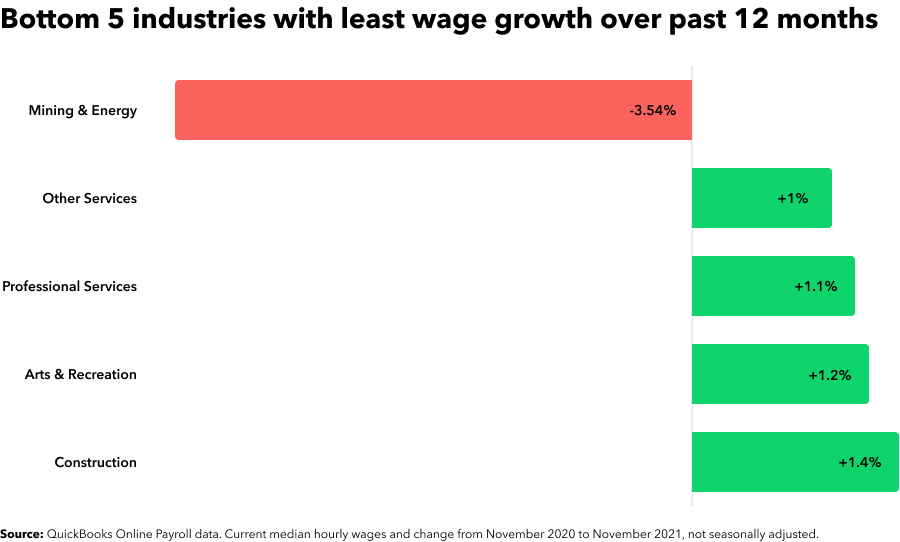
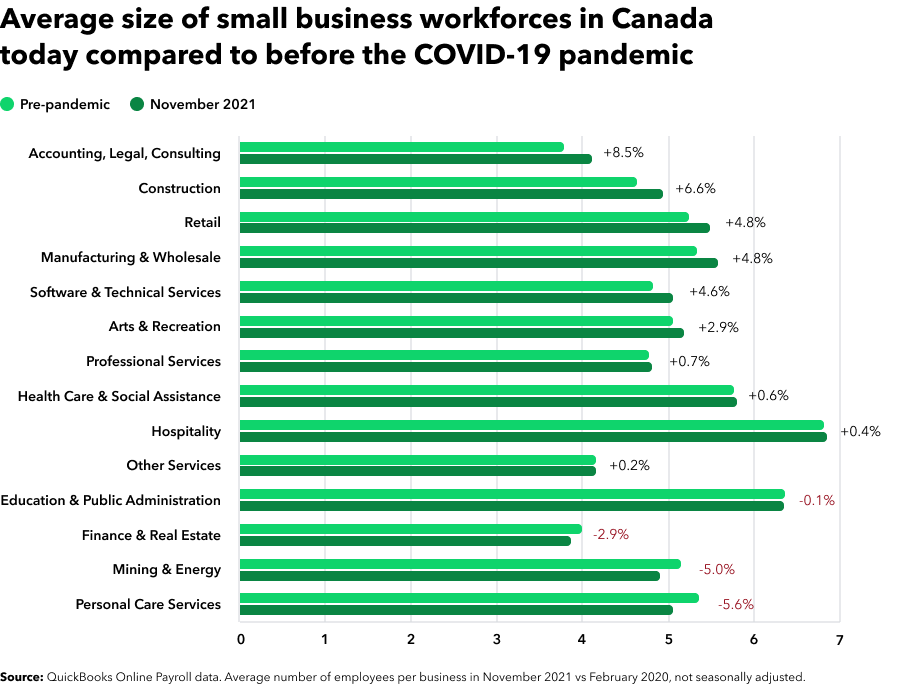
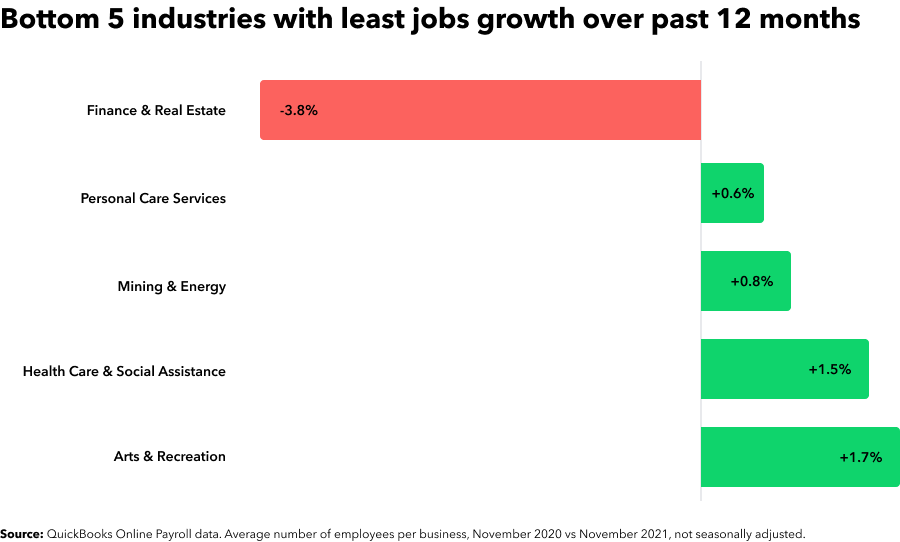
This is not survey data but anonymized, aggregate data from small businesses that use QuickBooks Online Payroll to manage their payroll between January, 2019 and November, 2021. Businesses that have used QuickBooks Online Payroll for less than two months were excluded from the dataset. All hourly wages are expressed as median values. Contractors and salaried employees were excluded from hourly wage calculations. Contractors and salaried employees are included in average employee calculations. Workforce growth rates are calculated by comparing the average number of paid employees per business for the current month against the average number of paid employees per business for the same month in the previous year (i.e. November 2021 vs November 2020). For example, if the average number of employees goes up from 5 to 6 from one period to the next, the increase is 20%. The data is not seasonally adjusted. The pre-pandemic benchmarks used in this report are from February 2020, the month prior to the first lockdowns being announced.
2. Small Business Survey
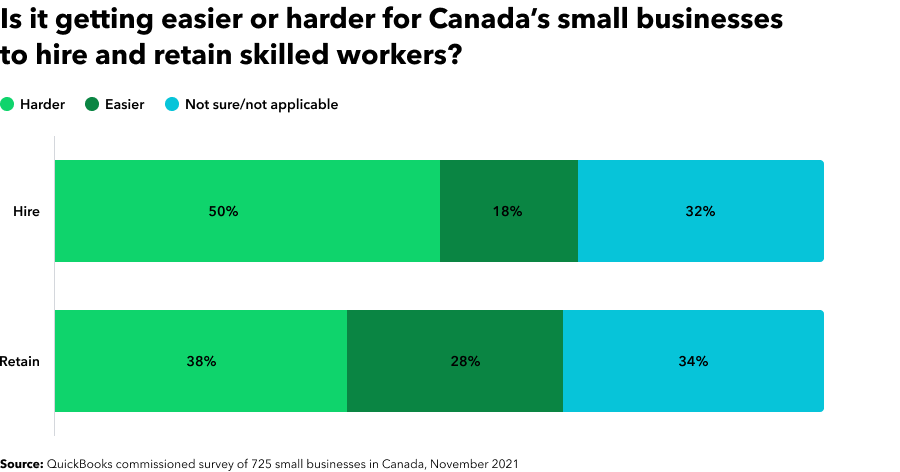
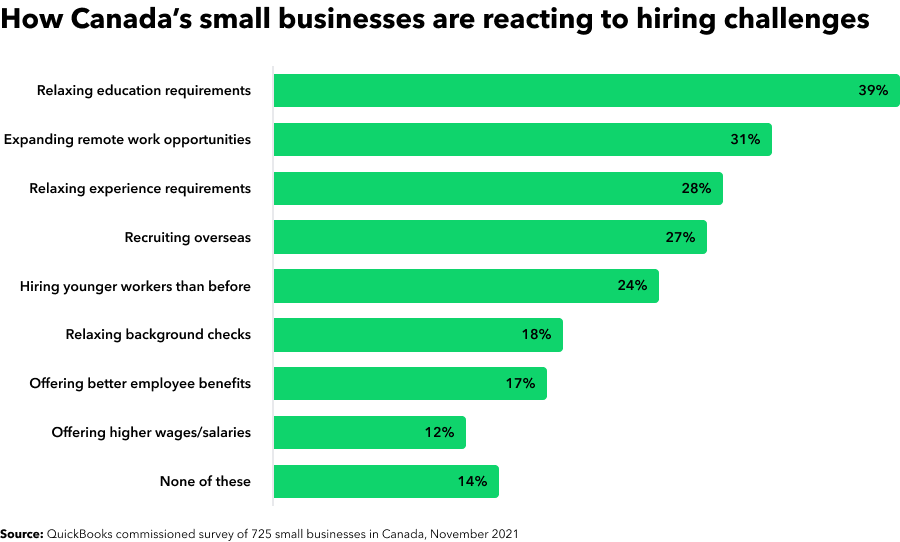
QuickBooks commissioned a 10-minute online survey among 725 small business owners in Canada from November 1 to 30, 2021. Respondents’ businesses have up to 100 employees and more than $5,000 in annual revenue. 57 of the 725 respondents answered the survey in French. More than one in three (34%) are brick-and-mortar businesses. The remainder are omni-channel, multi-channel or primarily online. Almost one in four (24%) are product-based businesses, close to one in two (45%) are service-based, and the remainder sell both products and services. Roughly one in seven (13%) are located in rural areas while the remainder are in urban or suburban locations. Percentages have been rounded to the nearest decimal place. Respondents received remuneration.
3. Employee Survey
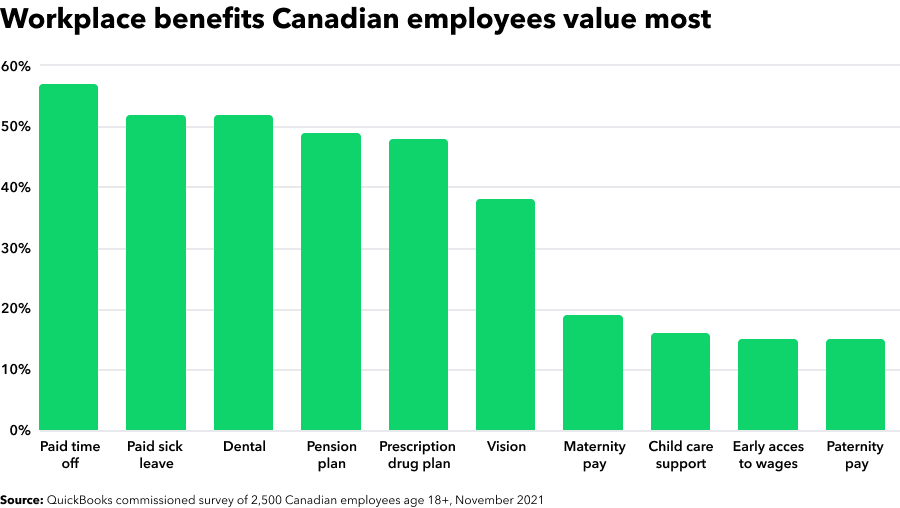
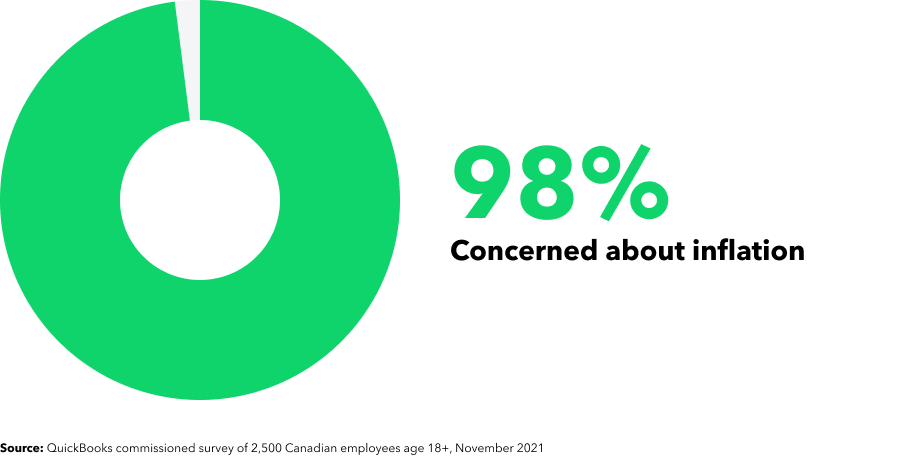
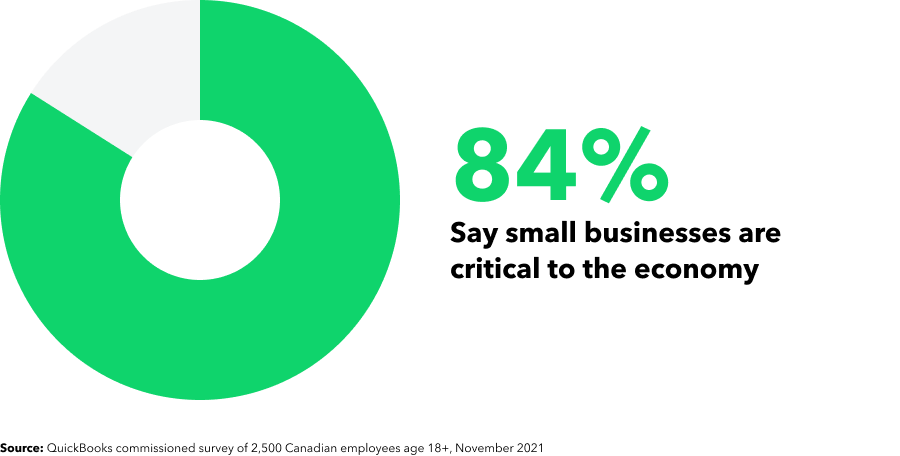
Commissioned by QuickBooks in November 2021, Pollfish surveyed 2,500 employees aged 18+ throughout Canada, with a 50:50 split between male and female respondents. 500 of the 2,500 respondents answered the survey in French. Responses were collected via Pollfish’s audience pools and partner network using double opt-ins and random device engagement sampling methodology to ensure accurate targeting.
This content is for information purposes only and should not be considered legal, accounting or tax advice, or a substitute for obtaining such advice specific to your business. Additional information and exceptions may apply. Applicable laws may vary by state or locality. No assurance is given that the information is comprehensive in its coverage or that it is suitable in dealing with a customer’s particular situation. Intuit Inc. does not have any responsibility for updating or revising any information presented herein. Accordingly, the information provided should not be relied upon as a substitute for independent research. Intuit Inc. does not warrant that the material contained herein will continue to be accurate nor that it is completely free of errors when published. Readers should verify statements before relying on them.
We provide third-party links as a convenience and for informational purposes only. Intuit does not endorse or approve these products and services, or the opinions of these corporations or organizations or individuals. Intuit accepts no responsibility for the accuracy, legality, or content on these sites.

