How growing teams can conduct a financial trend analysis
Now that you have a firm understanding of the pros and cons, here are the five steps a finance professional should take to carry out a financial trend analysis. Many experienced finance professionals are well versed in this process already, so this can serve as a guide, best practice, or training tool for your organization to follow.
Step 1: Decide on the key metric
When you begin, you need to set your objectives and determine which variable you want to measure. Key metrics may include sales, revenues, profit margin, cash flow, debt-to-equity, expenses, and return on investment (ROI).
For instance, by choosing your profit margin as a metric, it will measure the percentage of profit from your sales over a period of time. Alternatively, using a debt-to-equity indicator will show the trend in the ratio of debt-to-equity financing that’s being used in your business. To effectively analyze your company's overall financial well-being, it's essential to use multiple key metrics to ensure you're covering all angles.
Step 2: Gather the data
This vital step involves collecting the financial data needed for the analysis. Remember, it's crucial to have rigorous protocols in place to ensure high-quality data is gathered.
You can obtain this data from multiple sources, like financial statements. Fundamental documents will include your balance sheets, cash flow statements, and income statement. As such, having a cloud-based system can enable cross-functional teams to access real-time financial reports and foster collaboration.
When you’re on a time crunch and meeting an important deadline, it’s essential to have up-to-date financial reports. With QuickBooks Online Advanced, you have access to a cloud-based library of presentation-ready management reports that are easy to share with decision makers.
Step 3: Analyze the data
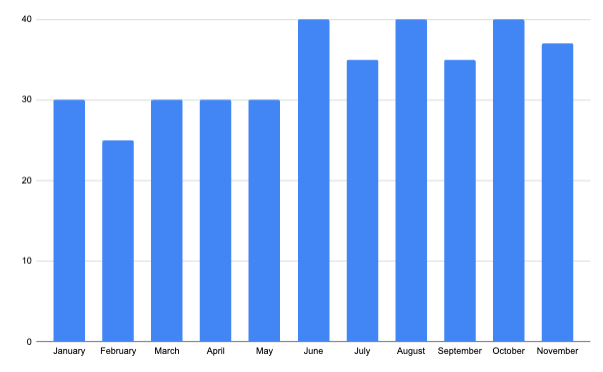
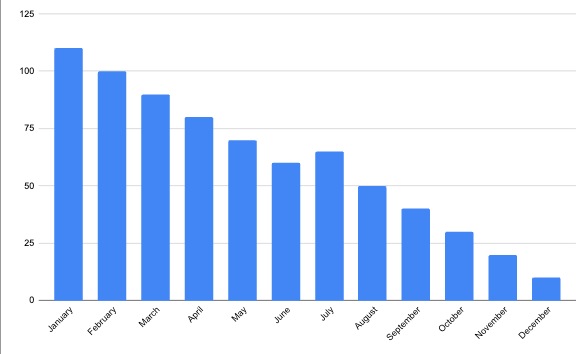
A finance manager can connect the dots to discover common patterns and trends. This is where they will notice whether the trend is upward, downward, horizontal, or seasonal. Based on the trends and the type of data being evaluated, your team can determine if your company is performing well or if there are areas for improvement.
Step 4: Draw conclusions
After completing the analysis of the financial data, you’ll need to interpret the results with precision. The team members who conduct this analysis must have strong knowledge of your business and the industry. This multifaceted approach requires team members to be up to date with external factors such as new and existing competitors, consumer demands, economic fluctuations, or political changes.
Additionally, the process requires you to have a solid understanding of the trends or patterns that have been identified. For example, if your team detects an increase in profit margins, this may be strong evidence that your business has effectively reduced costs.
In contrast, a decrease in sales may indicate that your customers are not making repeat purchases. Therefore, you may need to craft new marketing strategies or product offerings to maintain profitability.
Step 5: Make business decisions
In this final step, mid-sized businesses have the opportunity to mitigate certain risks or focus on a particular area that has growth potential. These business decisions need to align with the company’s goals and targets.
If your business is flourishing, this is an indication to continue following established protocols and maintaining the status quo. However, if you notice that costs are creeping up, you’ll need to uncover new strategies to minimize your expenses.
Your finance team will be required to report these findings to executives and decision makers within the organization. They may also need to involve key stakeholders such as the product, sales, or operations team to ensure the team is collectively working toward a common business objective and abiding by the company’s priorities.