Hello there, Jbock. I'm here to help you prepare a report that highlights your revenue, net income, and other key metrics so you can submit this to your Executive Director.
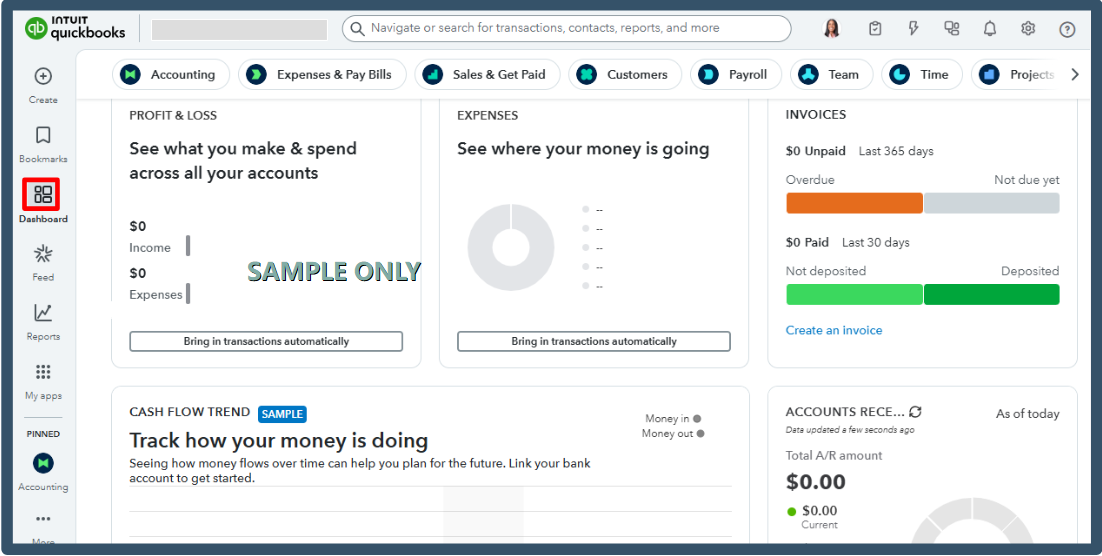
In QuickBooks Online, there's a feature that provides a clear overview of your finances, which is the Dashboard menu. It summarizes your income and expenses, provides a chart for profit and loss, and displays your bank account balances. However, some of the metrics you mentioned do not appear on this tab.
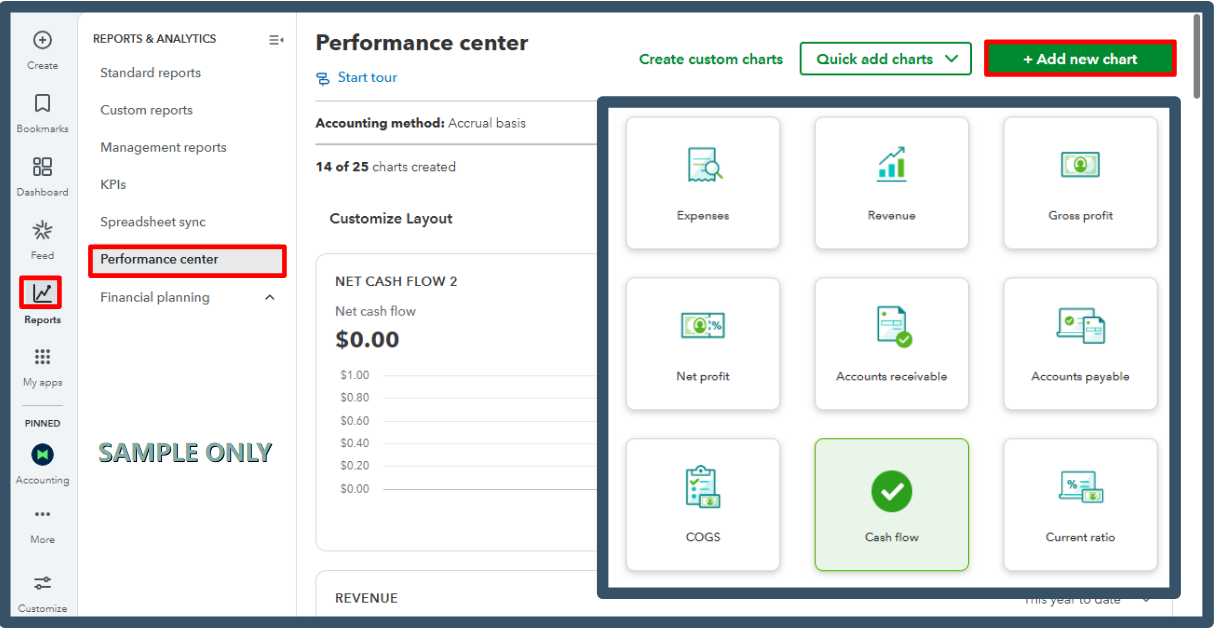
If you're using QuickBooks Online Advanced, you can use the Performance Center feature to showcase revenue, net income, and cash assets. However, census information isn't directly tracked within the platform.
Here's a sample screenshot for visual reference.
If you're using the Simple Start, Essentials, or Plus versions, we can generate the Profit and Loss report to gain insights into your revenue and net income and export it.
Here's how to do it:
- Hover over the Reports menu, then select Standard reports.
- In the Business Overview section, click Profit and Loss.
- Customize it as you wish, and then export it.
Next, we can pull up the Balance Sheet to see your cash assets and run the Audit Log for compliance tracking.
Lastly, pull up the Cash Flow Statement to look at your cash movements and export it.
After you have exported these reports, you can combine them outside of QuickBooks, or you can explore our third-party applications to find one that can create graphs and charts to summarize these metrics.
If you want to use the Performance Center feature, consider upgrading to the Advanced version.
Please feel free to leave a comment below if you have any further questions.