Turn on suggestions
Auto-suggest helps you quickly narrow down your search results by suggesting possible matches as you type.
Showing results for
Memorial Day Sale 90% OFF QuickBooks for 3 months.* Limited time only
Buy now & saveBuenas tardes
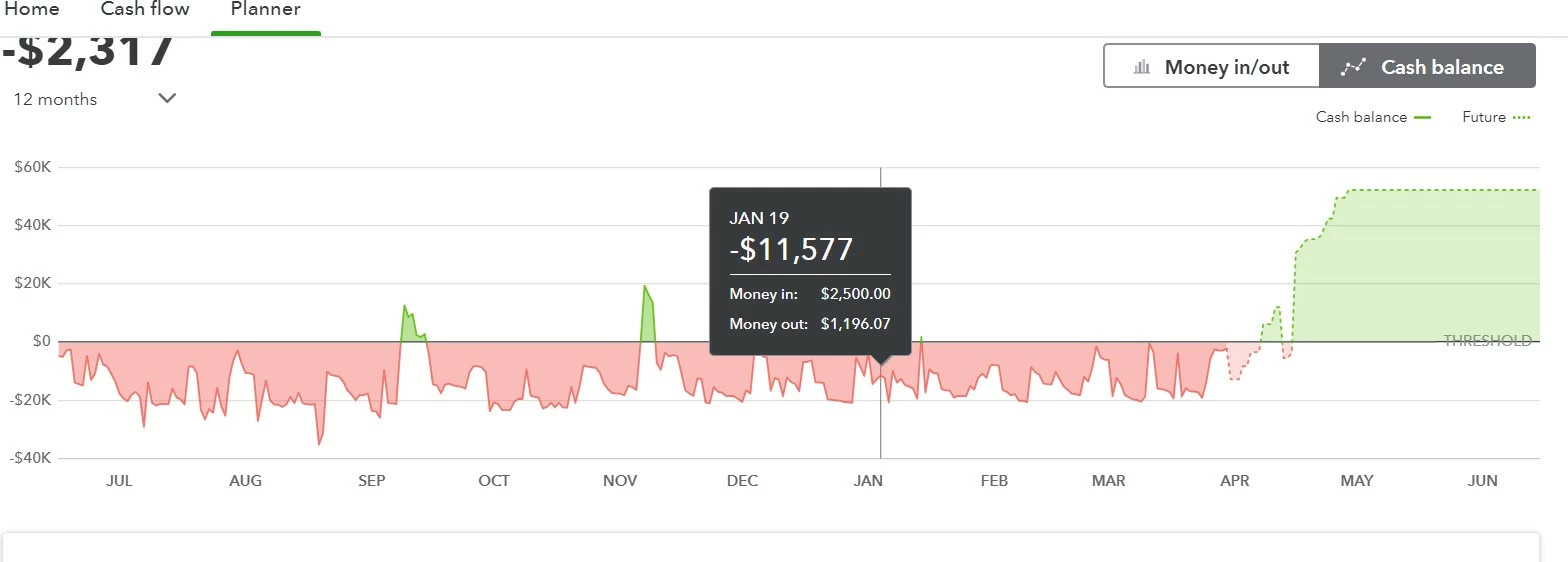
Tengo una pregunta es la siguiente al hacer la operación money in menos money out el resultado es un positivo pero la grafica lo muestra en rojo y el saldo negativo, esta calculando mal o que se debe de hacer para que tome en cuenta el saldo de caja:
En QuickBooks Online, el Planificador de Flujo de Caja es una función diseñada para ayudar a tu negocio a pronosticar y gestionar tu flujo de caja, Norma. Estaré encantado de aclarar cómo funciona el Planificador de Flujo de Caja en QuickBooks Online en relación con tus transacciones.
El planificador de flujo de caja en QuickBooks Online utiliza datos históricos de transacciones de cuentas bancarias y de tarjetas de débito conectadas, proporcionando una vista detallada de las transacciones categorizadas y no categorizadas.
Además, las transacciones cargadas manualmente en un archivo CSV también se integran, siempre y cuando estén vinculadas a cuentas bancarias y de crédito. Sin embargo, ten en cuenta que el gráfico de flujo de caja no incluye transacciones de tarjetas de crédito, transacciones ingresadas manualmente en QuickBooks, ni transacciones en múltiples monedas.
Ten en cuenta que esta herramienta no modifica ni afecta directamente ninguna de tus transacciones reales en QuickBooks.
Para obtener más información sobre cómo usar el Planificador de Flujo de Caja y gestionar el flujo de caja negativo, puedes consultar los siguientes artículos:
Usa el planificador de flujo de caja en QuickBooks Online y en Intuit Enterprise Suite
¿Qué es el flujo de caja negativo? 5 consejos para gestionarlo
Estos recursos proporcionan información detallada para ayudarte a navegar y aprovechar al máximo estas herramientas financieras.
Además, puedes consultar este artículo, que ofrece instrucciones detalladas y pasos para generar informes financieros en QuickBooks Online: Ejecutar informes en QuickBooks Online.
Puedes trabajar junto a nuestro Experto en Vivo de QuickBooks para optimizar tu contabilidad, navegar por QuickBooks Online (QBO) y desbloquear nuevas oportunidades para el crecimiento de tu negocio. Juntos, mejoraremos tu estrategia financiera. Comienza hoy mismo con el Experto en Vivo de QuickBooks.
No dudes en añadir un comentario abajo con tus preguntas adicionales sobre el flujo de caja. Estoy aquí listo para ayudarte. ¡Que tengas un buen día!
Descargo de responsabilidad, utilicé una de nuestras herramientas de traducción para traducir tu publicación al inglés.
..........................................................................................................................................................................................................................
In QuickBooks Online, the Cash Flow Planner is a feature designed to help your business forecast and manage your cash flow, Norma. I'd be happy to clarify how the Cash Flow Planner in QuickBooks Online works in relation to your transactions.
The cash flow planner in QuickBooks Online uses historical transaction data from connected bank and debit card accounts, providing a detailed view of both categorized and uncategorized transactions.
Additionally, transactions manually uploaded in a CSV file are also integrated, as long as they are linked to bank and credit accounts. However, please note that the cash flow chart does not include credit card transactions, transactions manually entered in QuickBooks, or multicurrency transactions.
Please know that this tool does not directly modify or affect any of your actual transactions in QuickBooks.
For more information on using the Cash Flow Planner and managing negative cash flow, you can refer to the following articles:
These resources provide detailed information to help you navigate and make the most out of these financial tools.
Additionally, you can check out this article, which provides detailed instructions and steps for generating financial reports in QuickBooks Online: Run reports in QuickBooks Online.
You can work alongside our QuickBooks Live Expert to optimize your bookkeeping, navigate QuickBooks Online (QBO), and unlock new opportunities for business growth. Together, we'll enhance your financial strategy. Get started with the QuickBooks Live Expert today.
Feel free to add a comment below with your additional questions you have regarding cash flow. I'm here ready to assist you. Have a good day ahead!
Disclaimer, I used one of our translator tools to translate your post in English.
pero quisiera saber por que sale en rojo cuando los saldos son positivos y no negativos.
Spanish version:
Gracias por seguir a la Comunidad, Norma Galan.
Al personalizar tu agenda, puedes establecer un Límite. Este es un monto que no debes superar. Todo lo que esté por debajo aparecerá en rojo en la agenda.
Si necesitas cambiar el límite, puedes hacerlo mientras personalizas la agenda.
Cómo hacerlo:
Si necesita agregar, editar o eliminar elementos de su planificador, puede seguir los pasos de nuestro artículo "Usar el planificador de flujo de efectivo".
No dude en responder si tiene alguna pregunta adicional. ¡Que tenga un buen miércoles!
-------------------------------------
English version:
Thanks for following up with the Community, Norma Galan.
When customizing your planner, you can set a Threshold. This is an amount you don't want to go under. Anything that's under it will appear in red on the planner.
If you need to change your threshold amount, you can do so while making customizations to the planner.
Here's how:
In the event you need to add, edit, or delete items from your planner, you can follow the steps in our Use the cash flow planner article.
Please don't hesitate to send a reply if there's any additional questions. Have a great Wednesday!
Es decir si al hacer la resta de :
Money in $4,397.67 menos money out: $56.17 el resultado es $4,341.50 pero en la gráfica dice -$7,926 mostrando un numero negativo y la gráfica en rojo para esa fecha 15 de febrero cuando el resultado de la resta es positivo porque el planner lo muestra así
?
Hola, Norma. ¡Vamos a resolver esto para verificar la visualización de tu planner!
El gráfico muestra tu saldo en efectivo en tiempo real de las cuentas bancarias vinculadas a QBO. Está rojo debido a tu saldo del 15 de febrero de -7,926, como se muestra en tu captura de pantalla, y permanecerá rojo si tu saldo sigue siendo negativo en los próximos meses. Sin embargo, con un saldo positivo actual de $13,335, el gráfico cambiará progresivamente a verde.
Adicionalmente, estás en lo correcto, la diferencia entre 4397.67 y 56.17 es una cifra positiva. Dado que el planner muestra un monto negativo, revisa otras transacciones o actividades dentro de tu cuenta que podrían llevar a un saldo negativo para esa fecha específica.
Aquí te explico cómo:
Haz clic en el ícono de Embudo para configurar correctamente el rango de fechas en la página de Registro bancario y luego aplica.
Alternativamente, ejecuta un reporte de Transacciones y personalizarlo para ver las entradas de ingresos y gastos en una fecha determinada.
Por favor, consulta este artículo para más información: Utiliza reportes para rastrear el flujo de caja en QuickBooks Online.
Déjame saber si necesitas más ayuda para rastrear transacciones o personalizar reportes.
Descargo de responsabilidad: Tenga en cuenta que utilicé una de nuestras herramientas de traducción para convertir su mensaje al inglés.
Hi, Norma! Let's figure this out to verify your planner's display.
The graph displays your real-time cash balance from linked QBO bank accounts. It is red due to your February 15 balance of -7,926 and will remain red if your balance stays negative in the coming months. However, with a current positive balance of $13,335, the graph will progressively shift to green.
Additionally, you're correct that the difference between 4397.67 and 56.17 is a positive figure. Since the planner shows a negative amount, review other transactions or activities within your account that may lead to a negative balance for that specific date.
Here's how:
Alternatively, run a Transaction report and customize it to view income and expense entries on a certain date.
Please refer to this article for more info: Use reports to track cash flow in QuickBooks Online.
Let me know if you need more help tracking transactions or tailoring reports.
Disclaimer: I utilized one of our translation tools to convert your message into English.
Es decir que mi Flujo de caja siempre debe de ser positivo para que el grafico muestre barras en verde ?
Sí, eso es correcto, Norma. Permíteme elaborarlo en detalle.
Las barras verdes significan resultados saludables. Un flujo de efectivo positivo en QuickBooks significa que no solo estás manteniendo las operaciones, sino también posiblemente creciendo. Monitorear regularmente estas métricas es esencial para una gestión financiera efectiva, apoyando el crecimiento sostenible y el éxito a largo plazo.
Para más información detallada sobre cómo utilizar el flujo de efectivo, consulta este artículo: Usa el planificador de flujo de efectivo en QuickBooks Online y Intuit Enterprise Suite.
Además, puedes generar informes para rastrear tu flujo de efectivo y ver tus finanzas actuales y futuras.
Estaré disponible si necesitas ayuda con algún otro aspecto relacionado con las finanzas. Regresa a este foro en cualquier momento y siempre estaré dispuesto a ayudar.
Descargo de responsabilidad: Ten en cuenta que estamos utilizando un traductor automático. No dudes en informarnos de cualquier discrepancia.
---------------------------------------------------
Yes, that's correct, Norma. Let me elaborate on it in detail.
Green bars signify healthy outcomes. A positive cash flow in QuickBooks means you are not just maintaining operations but also possibly growing. Regularly monitoring these metrics is essential for effective financial management, supporting sustainable growth and long-term success.
For more detailed information on utilizing cash flow, check out this article: Use the cash flow planner in QuickBooks Online and Intuit Enterprise Suite.
Additionally, you can run reports to track your cash flow and to view current and future finances.
I'll be around if there's something else you need help with handling finances. Return to this forum anytime and I'll always lend a hand.
Disclaimer: Note that we are using an automated translator. Please feel free to inform us of any discrepancies.
Me podría decir de donde toma QBO para mostrar los datos de las barras, es decir de donde toma el dato de money in $126,470.04 porque el monto que me muestra el profit and loss cash el monto es de $124,511.04, los montos no coinciden, por eso pregunto de donde toma los datos?
Gracias por tu rápida respuesta y por adjuntar una captura de pantalla, Norma. Te mostraré de dónde provienen las cifras y aclararé por qué los montos bajo la pestaña Planificador difieren de los del informe de Pérdidas y Ganancias (P&L).
Los montos mostrados en las barras bajo la pestaña del Planificador, específicamente en el mosaico de Ingreso/Salida de dinero para los meses correspondientes, representan:
Refiriéndose a la captura de pantalla proporcionada, parece ser del mes anterior y no tiene el estado de Futuro indicado. Por lo tanto, $126,470.04 representa transacciones bancarias de ingreso (por ejemplo, ingresos). Por otro lado, $128,949.96 representa transacciones bancarias de salida (por ejemplo, gastos).
Ahora, para responder a su pregunta sobre por qué las cifras en el mosaico de Ingreso/Salida en la pestaña del Planificador no coinciden con las del informe de Pérdidas y Ganancias, hay dos razones principales:
Primero, considere los métodos contables utilizados. Para el método contable de efectivo, el informe de Pérdidas y Ganancias muestra movimientos reales de dinero: ingresos recibidos, gastos pagados y transacciones categorizadas. En contraste, el método contable de acumulación rastrea los ingresos y gastos cuando se incurren, no cuando se intercambia el dinero.
Segundo, considere las cuentas representadas. Los informes de Pérdidas y Ganancias solo incluyen cuentas categorizadas bajo ingresos o gastos. En algunas situaciones, las transacciones bancarias pueden clasificarse bajo otras cuentas, como el patrimonio, que están excluidas de los informes de Pérdidas y Ganancias pero están incluidas en la pestaña del Planificador, ya que siguen siendo transacciones bancarias descargadas. Por lo tanto, los montos no coinciden.
Por último, proporcionaré algunos recursos adicionales que puedes leer para aprender más sobre cómo usar los informes para rastrear tu flujo de caja y maximizar los beneficios de tus informes financieros:
Nuestro objetivo es asegurarnos de que tengas una comprensión completa de cómo funciona el planificador de flujo de caja. Si tienes alguna pregunta, necesitas más detalles o deseas discutir escenarios específicos, por favor compártelos en la sección de comentarios a continuación. Estoy aquí para ayudar.
Note: This post was translated using a translation tool to generate Spanish to English conversion. Feel free to let us know in the comments section for any mistranslation. You can check out the English translation below.
Thank you for your quick response and for attaching a screenshot, Norma. I'll share where the figures come from and clarify why the figures under the Planner tab differ from those in the Profit and Loss (P&L) report.
The amounts displayed in the bars under the Planner tab, specifically in the Money In/Out tile for the corresponding months represent:
Referring to the provided screenshot, it appears to be from the previous month and doesn't have the Future status indicated. Therefore, $126,470.04 represents money-in bank transactions (e.g., income). On the other hand, $128,949.96 represents money-out bank transactions (e.g., expenses).
Now, to answer your question regarding why the figures in the Money In/Out tile on the Planner tab do not match those in the P&L report, there are two main reasons:
First, consider the accounting methods used. For the Cash accounting method, the P&L report shows actual money movements—income received, expenses paid, and categorized transactions. In contrast, the accrual accounting method tracks income and expenses when they are incurred not when cash is exchanged.
Second, consider the represented accounts. The P&L reports only include accounts categorized under income or expense. In some situations, bank transactions can be classified under other accounts, such as equity, which are excluded from the P&L reports but are included in the Planner tab as these are still downloaded bank transactions. Hence, the amounts don't match.
Lastly, I'll provide some additional resources that you can read to learn more about using reports to track your cash flow and maximize the benefits of your financial reports:
Our goal is to ensure you'll have a complete understanding how the cash flow planner works. If you have any questions, need more details, or want to discuss specific scenarios, please share them in the comments section below. I'm here to help.
Pero en la imagen que mostré es enero 2025, es decir ya paso esa fecha, aun así, no puede coincidir con el monto real que muestra el P&L?
He actualizado mi respuesta anterior, Norma. Además, compartiré las aclaraciones sobre por qué tu informe de Pérdidas y Ganancias podría no alinearse con el gráfico del Planificador bajo el mosaico de Ingreso/Salida de dinero, incluso después de que el mes haya concluido.
Considerando los factores que mencioné, como el método contable y las cuentas específicas representadas en el informe de Pérdidas y Ganancias (P&L), es importante notar que el informe de P&L y el Planificador de Flujo de Caja en QuickBooks Online (QBO) tienen propósitos diferentes. Como resultado, pueden no coincidir exactamente debido a las diferentes perspectivas financieras que proporcionan.
Proporcionaré una breve comparación entre los dos para ayudar a aclarar las diferencias y asegurar una comprensión completa:
Además, como mencioné en mi publicación inicial, algunas cuentas aparecen en el informe de P&L pero no en el Planificador de Flujo de Caja, lo que explica por qué los montos pueden no coincidir. Mientras tanto, el gráfico del Planificador solo se enfoca en transacciones de ingreso y salida de dinero, que se pueden ver usando el botón de Filtro.
Tenga en cuenta también que la planificación de flujo de caja es solo para propósitos informativos y que los resultados reales pueden variar. Para una vista detallada de tus movimientos de efectivo, puedes generar el informe de Estado de Flujo de Caja o descargar los informes financieros relevantes que muestren el flujo de efectivo real desde la página del Planificador.
Por último, compartiré algunos recursos adicionales para ayudarte a aprender cómo usar los informes de manera efectiva para rastrear tu flujo de caja y maximizar los beneficios de tus informes financieros:
Añade una respuesta si necesitas aclaraciones adicionales sobre cómo gestionar tu planificador de flujo de caja. Estaré aquí para ofrecer una mano de ayuda.
Note: This post was translated using a translation tool to generate Spanish to English conversion. Feel free to let us know in the comments section for any mistranslation. You can check out the English translation below.
I've updated my response above, Norma. I'll further share the clarifications as to why your Profit and Loss report might not align with the Planner chart under the Money In/Out tile, even after the month has concluded.
Considering the factors I've mentioned, such as the accounting method and the specific accounts represented in the Profit and Loss (P&L), it's important to note that the P&L report and the Cash Flow Planner in QuickBooks Online (QBO) serve different purposes. As a result, they may not match exactly due to the different financial insights they provide.
I'll provide a brief comparison between the two to help clarify the differences and ensure complete understanding:
Moreover, as mentioned in my initial post, some accounts appear in the P&L report but not in the Cash Flow Planner, which is why the amounts may not align. Meanwhile, the Planner chart only focuses on money-in and money-out transactions, which can be viewed by using the Filter button.
Please also note that cash flow planning is for informational purposes only and that actual results may vary. For a detailed view of your cash movements, you can generate the Statement of Cash Flow report or download the relevant financial reports that display actual cash flow from the Planner page.
Lastly, I'll share some additional resources to help you learn how to use reports effectively to track your cash flow and maximize the benefits of your financial reports:
Add a Reply if you have further clarifications about managing your cash flow planner. I'll be here to offer a helping hand.
You have clicked a link to a site outside of the QuickBooks or ProFile Communities. By clicking "Continue", you will leave the community and be taken to that site instead.
For more information visit our Security Center or to report suspicious websites you can contact us here