
Jonathan Rothwell
Principal Economist
Editor’s note — This report was published in 2019. Newer research may show a significant change due to current events.


Jessica Harlan
Sr. Research Consultant
About the report
QuickBooks commissioned the Gig Economy and Self-Employment Report from Gallup to help us better understand what success means to people who work for themselves, whether they do so full-time, part-time or on the side. All research was done and is owned by Gallup, Inc.
Related articles


1/2
Report overview
Despite best efforts, the true state of self-employment in the U.S. has largely remained unknown. Due to an inconsistent—and perhaps incomplete—look at self-employment qualifiers, federal agencies haven’t been able to nail down just how many workers in the country are working for themselves.
But with research from all angles, Gallup found the most complete look at self-employment trends in the country.
28%
Gallup found that 28% of workers have some kind of self-employment. About half of that, 14%, rely on self-employment as their primary income.
Main findings and statistics
All-time high
Just how many adults are engaged in self-employment? In 2017, it was the highest percentage since the IRS started reporting in 1957—17%.
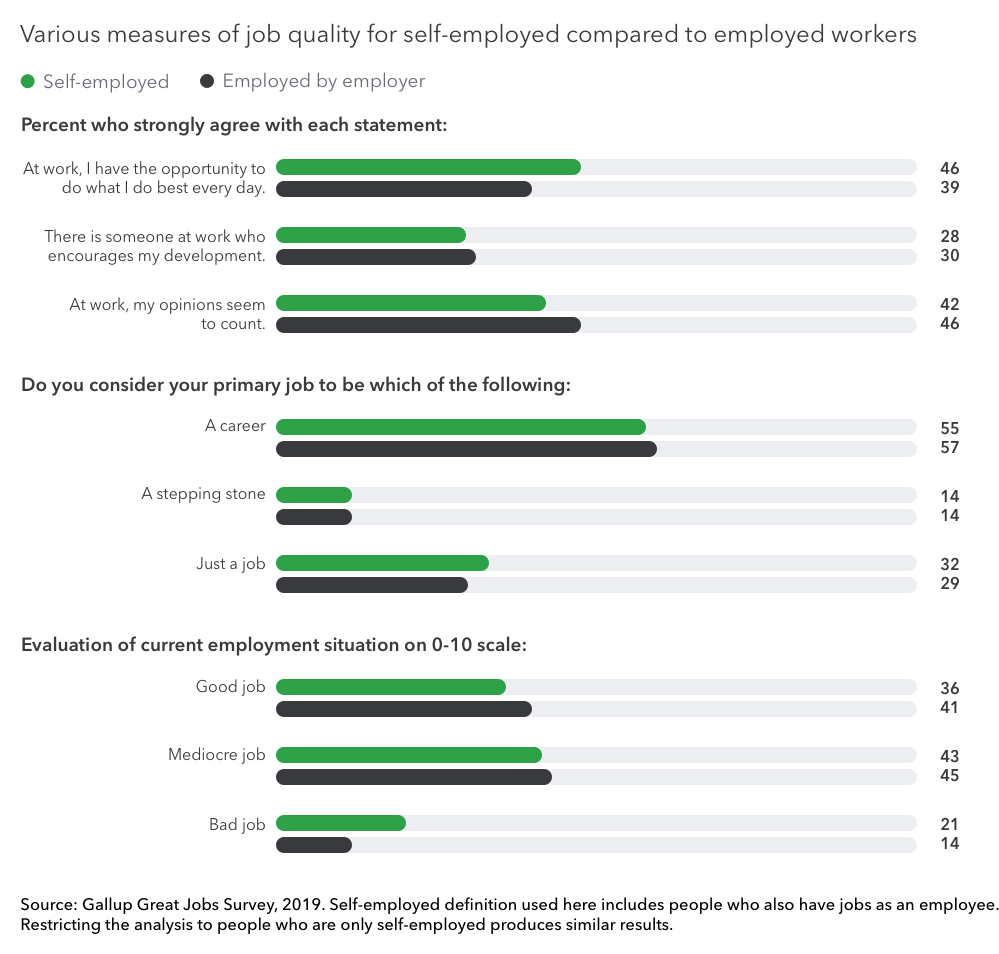
Overall satisfaction
Self-employed workers experience a slightly lower overall job quality, but a greater sense of control and belief that they’re regularly using their strengths.
Major growth
There was a +722% growth in sole proprietors from 2000 to 2017.
Primary and extra income
Whether they rely solely on self-employment income or use it as supplementary income, 28% of workers report being self-employed at some time during a given week.
More side hustles
Twice as many self-employed workers (22%) work multiple jobs to make money as those who work for an employer (11%).
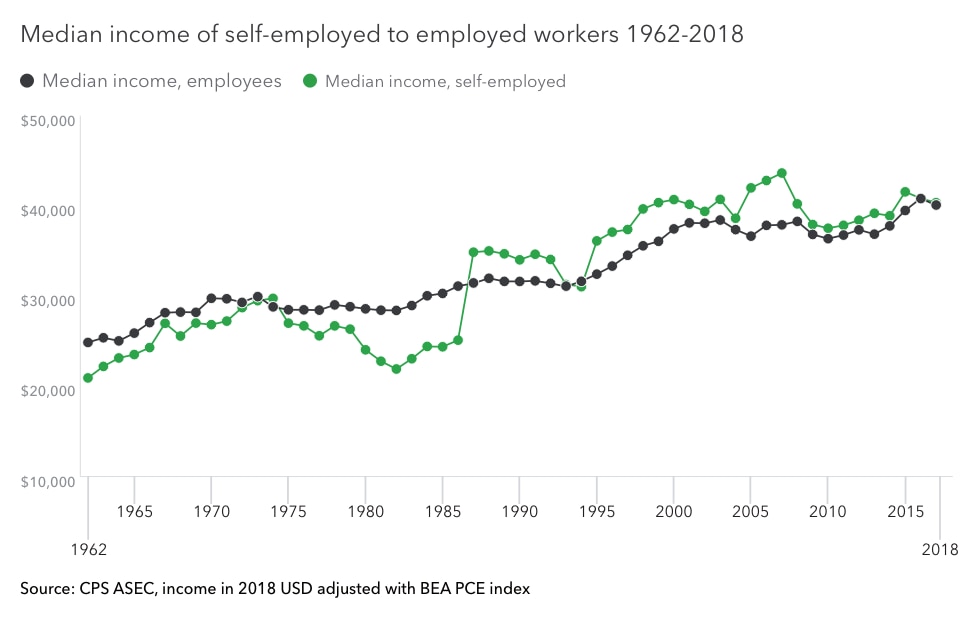
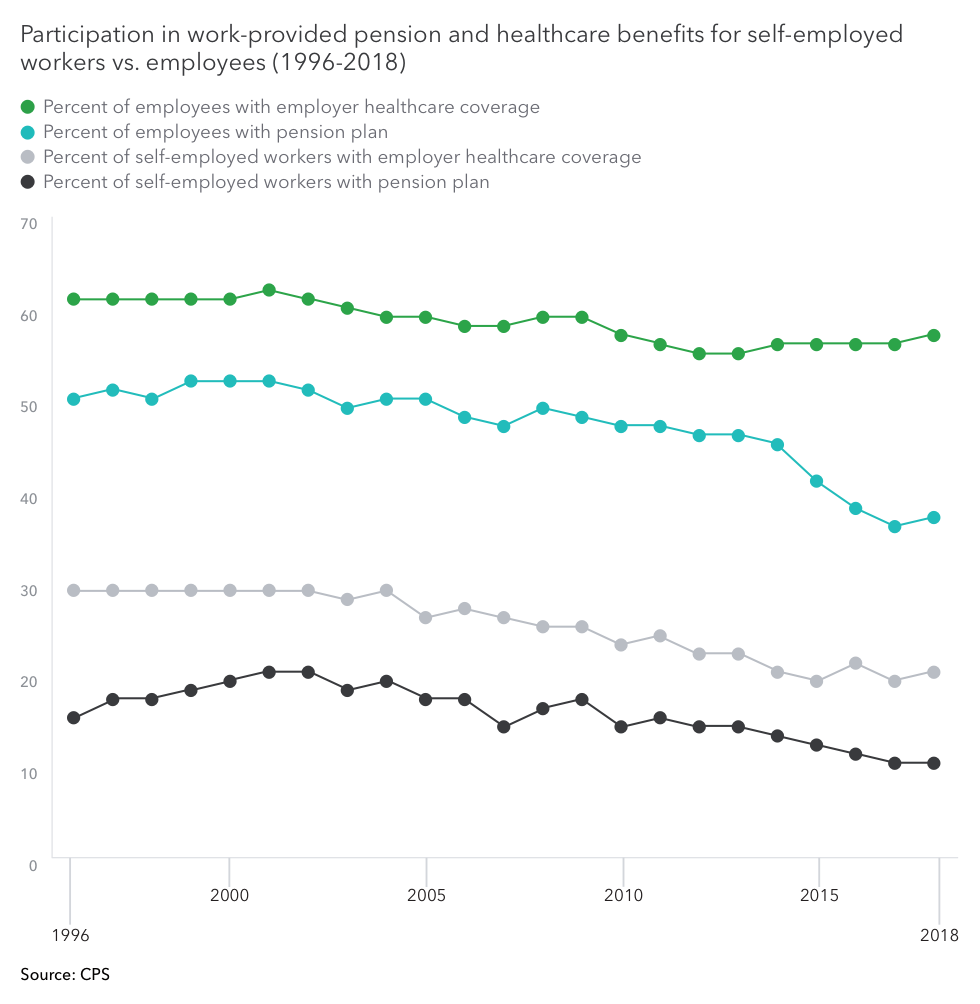
Similar income, fewer benefits
The median income of those primarily self-employed ($34,751) is similar to those who work for employers ($40,800). However, the total compensation is less due to lower benefits.
State trends
Percent of tax returns paying self-employment tax (IRS) 2000-2017
Most of the 50 states saw an increase in self-employment tax filing from 2000-2017. The states with the biggest increase were Vermont, Georgia, and Florida. Those that saw the biggest decrease were North Dakota, South Dakota, and Montana.
Self-employed workers enjoy the same overall quality of life as employed workers. The lower satisfaction levels with the material aspects of their job—such as benefits and the stability of pay—seem to be balanced by the satisfaction from greater autonomy and use of their strengths.

Popular jobs for self-employed
Self-employment spans over 18 industries in the U.S. And among them, the top five are:
Gallup found that nearly 11% of the overall change in sole proprietorships since 2000 is all thanks to the taxi industry, likely as a result of Uber and Lyft drivers.

Self-employed vs. employees
Media outreach
Looking for more? Reach out to us:
Jennifer Garcia: jennifer_garcia@intuit.com
Kim Amsbaugh: kim_amsbaugh@intuit.com
Call Sales: 1-800-285-4854