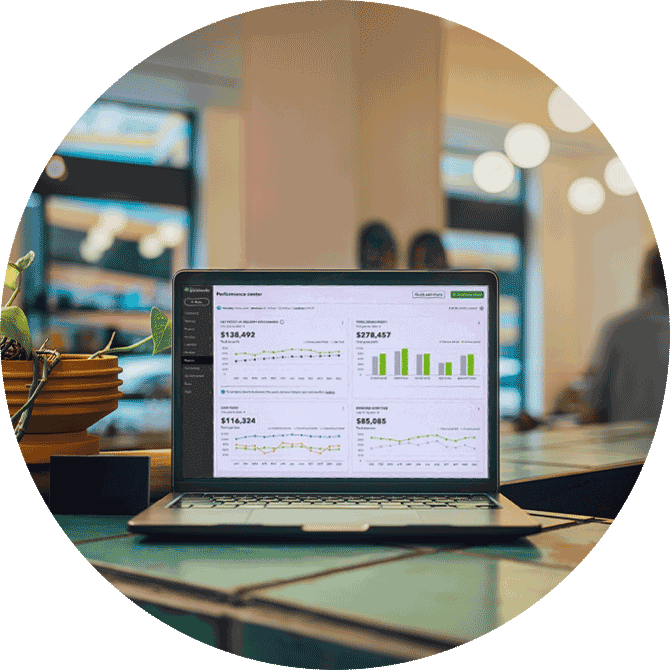

Business reporting made easy
Monitor business performance at every stage with Advanced reporting tools.
- Get real-time insights with financial statements—like income statements and balance sheets.
- Create a spending roadmap to ensure you reach your business goals.
- Tailor your reports to the info that matters and keep your accountant in the loop with email updates.
- Seamlessly send data back and forth between QuickBooks Online Advanced and Excel for more accurate business data and custom insights.**

Get insights from your revenue streams dashboard
QuickBooks Online Advanced helps you keep a pulse on your top money-makers.
- Know what’s contributing to your top money-makers with a dashboard you can customize.
- Configure your dashboard by accrual vs. cash basis, fiscal year, date range, classes, locations, and more.
- Identify what’s working and what’s not quickly and share reports with your accountant.

Know your cash flow and what drives it
Monitor money in and money out with cash flow reports QuickBooks Online Advanced.
- Quickly see cash flow trends with auto-populated trend lines or customize reporting time periods using built-in filters.
- Drill down into cash flow categories and identify changes with a few clicks.
- Easily benchmark and compare cash flow from different time periods.

Easily build customized reporting dashboards
Customize dashboards to show the details that matter most to you.
- Customize dashboards for the KPIs that matter most to your business.
- Easily edit dashboards on the fly to examine metrics.
- Collaborate easily with others—share customized dashboards with team members who have reporting access.**

Automatically sync your spreadsheets
Get more accurate data and reporting with spreadsheet sync in Advanced.**
- Add and edit spreadsheet data in bulk and reduce manual entry.
- Leverage Excel with Advanced to track business performance.
- Utilize templates and build consolidated reports for multiple companies.
- Work with data your way when you combine Excel and Advanced.
“I’m very impressed with reporting, and we haven’t even begun to scratch the surface of what Advanced can do.”
Leslie J., Finance Manager, Graywolf Press
“Advanced allows us to set permissions so we can easily share reports that provide granular views of each department's data. Managers can drill down further into the data within those reports so they can see everything they need to see.”
Robert C. COO/CFO, Sacramento Zoo
Frequently asked questions
Call Sales: 1-877-877-9185