Understand the sales tax liability report in QuickBooks Online
by Intuit•3183• Updated 1 month ago
Learn how sales tax is calculated and how it displays in the sales tax liability report.
See how sales tax is calculated
To understand how sales tax is calculated, select See the math on an invoice or sales receipt.
You’ll see:
- if you’re using an automatic sales tax calculation or custom rates.
- The rate and breakdown for the taxable location at the state, county, and city level.
If an item hasn’t been categorized, the standard rate applies. By categorizing your products and services, you’ll ensure that you’re charging and collecting the correct amount of sales tax.
What the sales tax liability report shows you
We’ll use the following scenario to show a real example:
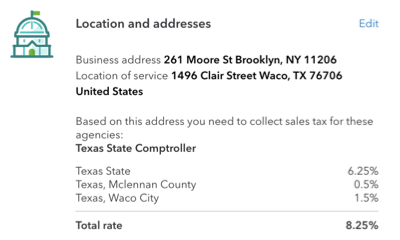
- Your company is based in New York and ships goods to customers in Texas.
- The Texas sales tax agency was added to QuickBooks and your company collects and pays sales tax in Texas.
- Your company uses QuickBooks automatic sales tax calculations (based on location) on all transactions.
Note: All images show the sales tax calculations for Texas only.
The sales tax liability summarizes the breakdown of sales tax for all transactions in Texas during the reporting period.
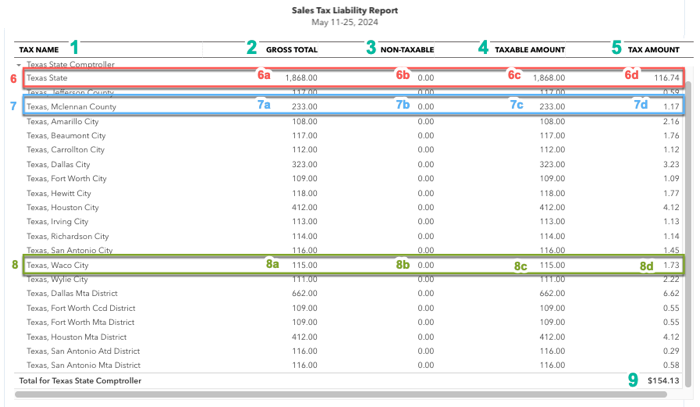
- Tax name (column 1): Tax info is separated into state, city, and county. Each level is assigned a tax name. With the state, there may be additional levels you can see by selecting See the math from your transaction.
- Gross total (column 2): The total net value (no sales tax included) of all sales, taxable and non-taxable. Invoices and sales receipts increase the gross total while credit memos and refund receipts reduce it. Your state may refer to this as total sales, or total gross receipts.
- Non-taxableamount (column 3): Transactions can be made non-taxable in the following ways:
- Sale to an exempt customer.
- Tax isn’t selected on the sales form.
- The product or service on the sales form has been marked as non-taxable.
- The product/service on the sales form has been mapped to a category which is fully or partially nontaxable.
Note: A sales form can contain both taxable and nontaxable lines. Transactions that aren’t sales forms, like bank deposits and journal entries, aren’t included on the sales tax liability report.
- Taxable amount (column 4): The net amount appears in this column for taxable transactions.
- Tax amount (column 5): The sales tax charged on taxable sales, which also shows the sum total you owe.
- State tax (first row): totals reflect all sales in the state, including county and city.
- 6a) The total gross sales value for every transaction in this state.
- 6b) The total value of non-taxable sales for every transaction in the state.
- 6c) The total value of taxable sales for every transaction that happened in the state.
- 6d) The sales tax amount charged at state level for the total taxable sales.
In this example, the amount is 6.25% of the taxable amount (column 6c). No county or city taxes are included in this amount. Sometimes more than one rate applies to the state, for example, if a special food rate pertains to some sales.
- County tax: totals are included in the state amounts as sales happen in the state.
- 7a) The total gross sales for every transaction in this county. Sales in multiple counties will show individual counties.
- 7b) The total amount of nontaxable sales for every transaction in this county.
- 7c) The total net value of taxable sales for every transaction in this county.
- 7d) The sales tax which was charged at county level for the total taxable sales. There are no state or city level taxes included in this amount. For example, in McLennan County this amount is 0.5% of the taxable amount (column 7c). As with the state level, more than one tax rate can be applied at county level.
- City tax: totals are also included in state and county amounts.
- 8a) The total gross sales for every transaction in this city. Sales in multiple cities will show different cities in this report.
- 8b) The total amount of non-taxable sales for every transaction in this city.
- 8c) The total net value of taxable sales for every transaction in this city.
- 8d) The sales tax charged at city level for the total taxable sales. In our example, this amount is 1.5% of the taxable amount (column 8c). This is the city tax for Waco City as you can see in the See the math panel. There are no state or county level taxes included in that figure. More than one rate can be applied at this level, like the county and state level.
The Gross total, Non-taxable, and Taxable amount columns can’t be added up to provide a sum total because, in our example, there are 3 levels (state, city, county). The transaction is fully taxable at each level, so for a single transaction, the net value of the sale appears 3 times.
With the Tax Amount column, it’s possible to sum up all the values to give you a total tax due the State Comptroller. This is because in the tax amount column, each value only appears once. Our example shows: the state taxes (6.25%), the county taxes (0.5% in McLennan county, but can vary in different counties), and the city rate (1.5% in Waco City, but can vary by city).
More like this
- Nevada sales tax liability reporting in QuickBooks Onlineby QuickBooks
- Review sales tax reportsby QuickBooks
- Create or delete a sales tax adjustment in QuickBooks Onlineby QuickBooks
- Switch to automated sales taxby QuickBooks