


A monthly index tracking small business employment, revenue, and job vacancies in the US, Canada, and the UK.

Small Business Index
Jump ahead: How to use the data | About the Index
Get the latest data
Small business employment trends in February 2026
US small business employment decreased by 45,300 jobs in February 2026, according to the Intuit QuickBooks Small Business Index. Small businesses now employ 12,626,500 people. By sector, the fastest decline was in leisure & hospitality. By region, the fastest decline was in the Great Lakes. By state, the fastest decline was in Ohio.
Use the dashboard above to explore this data, or to get the same data for Canada or the UK.
Small business revenue trends in February 2026
Average real monthly revenue at US small businesses was $53,580 in February 2026, according to the Intuit QuickBooks Small Business Index. Overall, the average monthly decline was 1.03%. By sector, the fastest decline was in utilities. By region, the fastest decline was in the Plains. By state, the fastest decline was in Arizona.
Use the dashboard above to explore this data.
Get the latest data insights in your inbox
Sign up to get the latest insights from the Small Business Index as soon as they are published each month.
Thanks for subscribing.
We'll send you the latest insights from the Small Business Index as soon as they are published each month.
How to use the data
For small businesses
- Benchmark performance: Compare your monthly employment and revenue growth against the average for your sector, region, or state. This shows if an upturn or downturn matches wider trends.
- Find nearby growth: Use the region or state filters to spot areas with high growth. This data can inform your planning for marketing, hiring, or expansion.
For accountants
- Benchmark performance: Use this data to compare performance against the local or industry average. This applies both to your clients and your firm.
- Spot growth opportunities: Use state, sector, or regional data to identify high-growth areas. This can inform staffing, pricing, and cash flow targets.
For policymakers and economists
- Get timely data on small business trends: This data provides a reliable monthly signal of how small businesses are doing ahead of official statistics.
- Target policy and investment: Use the state, sector, or regional data to identify emerging economic shifts and assess the impact of policies on small business performance.
For the media
Media contact details for QuickBooks in the US can be found here on the Intuit website. When citing this data, please credit the Intuit QuickBooks Small Business Index.
What is the Small Business Index?
The Intuit QuickBooks Small Business Index tracks monthly changes in small business employment, job vacancies, and revenue—showing where we’re seeing the most and least growth. It’s available in the US, Canada, and the UK, with fresh data added every month. The methodology was developed by an international team of economists led by Ufuk Akcigit, the Arnold C. Harberger Professor of Economics at the University of Chicago.
Learn more from Professor Ufuk Akcigit

Which small businesses are included?
In the US and the UK, the Small Business Index currently tracks growth at small businesses with 1 to 9 employees. In Canada, it tracks growth at small businesses with 1 to 19 employees.
What does it tell us about the economy?
In the US, Canada, and the UK, the Small Business Index shows the current number of jobs at small businesses. In the US, it also tells us how much monthly revenue small businesses earn, on average, adjusted for inflation. And in the UK, it also shows the number of job vacancies at small businesses. All data is seasonally adjusted.
How much of the economy does it cover?
The Small Business Index provides up-to-date monthly estimates for approximately:
- 75% of all US employers and 10% of all US jobs (source)
- 90% of all Canada’s employers and 25% of all Canada’s jobs (source)
- 80% of all UK employers and 20% of all UK jobs (source)
Data is available nationally, regionally, and by sector. In the US, it’s also available for 20 states: Arizona | California | Colorado | Florida | Georgia | Illinois | Indiana | Michigan | Minnesota | Missouri | New York | North Carolina | Ohio | Oregon | Pennsylvania | Tennessee | Texas | Virginia | Washington | Wisconsin.
What’s the sample and methodology?
The current worldwide sample is more than 533,000 small businesses that manage payroll and invoices on the QuickBooks platform. Before publication, this data is anonymized, adjusted with official statistics, and aggregated by country, region, or sector. Read the methodology or download the full academic paper to learn more.
The current sample in each country is at least:
- 420,000 small businesses for the US employment index
- 333,000 small businesses for the US revenue index
- 87,000 small businesses for Canada’s employment index
- 26,000 small businesses for the UK employment and job vacancy indexes
How often is it published?
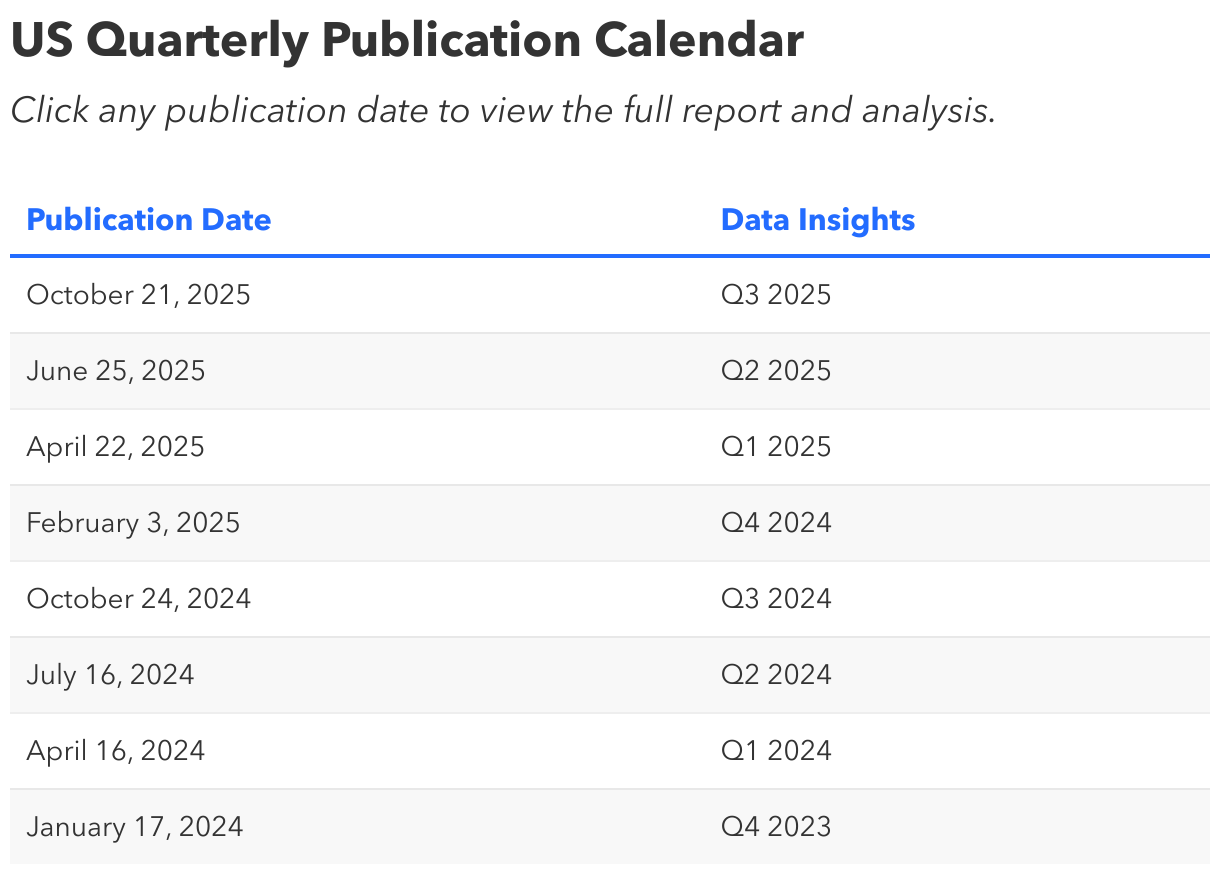
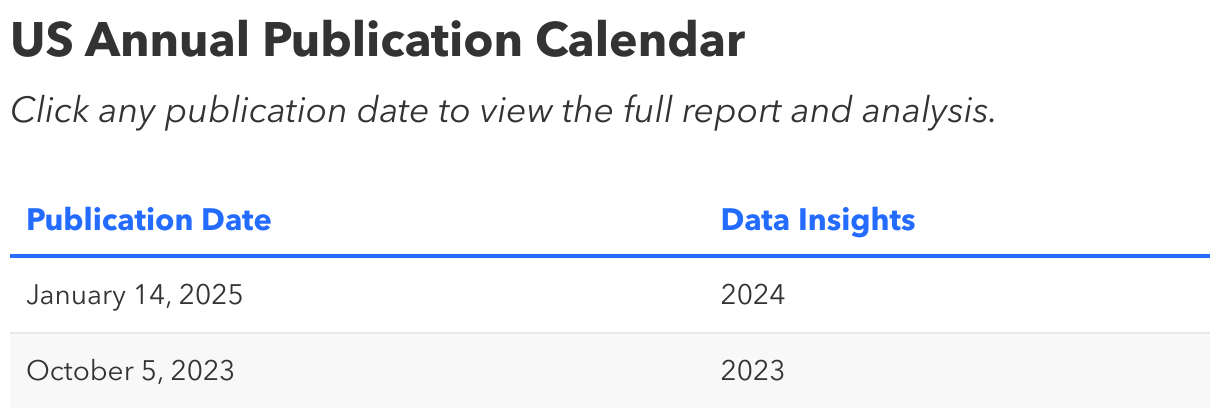
The Small Business Index is published monthly, with the previous month’s data added at the beginning of every month. Longer-term trends are available in quarterly and annual reports which include additional insights from official statistics and the quarterly Small Business Insights survey. Get all future release dates from the publication calendar.
Read the latest reports
Monthly reports

Quarterly reports
Annual reports
Academic papers
Additional resources


Looking for something else?
Call Sales: 1-800-285-4854