You could save up to 25% on transaction costs².
Speak with us now to see if you qualify.
Talk to sales 1-800-515-8366
Monday - Friday, 6 AM to 4 PM PT

Table of contents
Table of contents
With 7 in 10 Americans reporting that a lack of financial confidence directly impacts their ability to reach their goals, mastering the basics of business accounting is more critical than ever.
When you manage business finances, three primary reports tell your story: the balance sheet, the profit and loss (P&L) statement, and the cash flow statement. Understanding how these two documents interact is essential for tracking your financial health and making informed decisions.
In this guide, we clarify the differences between these statements and how they work together. To stay organized, you can also use our downloadable financial statement cheat sheet below.
While both reports are essential, they provide different insights into your business. The P&L tells you if you are making money, while the balance sheet tells you what you are worth.
However similar they may seem, several key differences set them apart. Let’s explore those differences in the table below.
The profit and loss statement gets prepared first. The resulting net income is then used to update the retained earnings on the balance sheet.
The three financial statements work coherently together to provide a comprehensive view of the company and its financial position. They are prepared in a specific order since the information from one affects the others. The order goes like this:
This sequential relationship ensures accuracy and consistency across all financial reports.
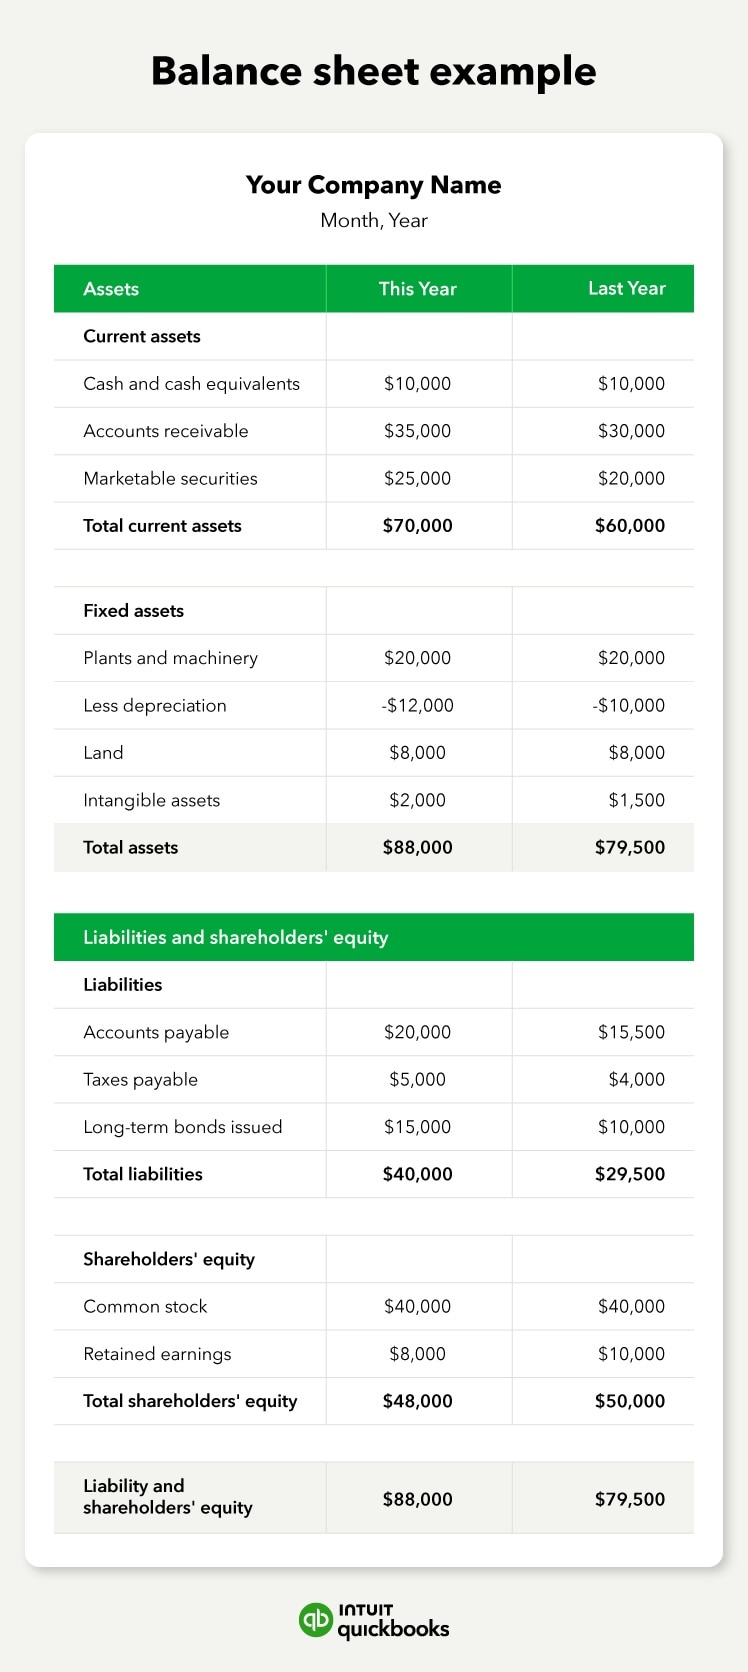
The balance sheet is a financial statement that reports a company's assets, liabilities, and shareholders' equity. Think of it as a snapshot in time. It shows exactly what your business owns and owes at a specific point in time, such as the last day of a month or year.
Because it summarizes the overall financial position, it is often called the statement of financial position. This report is built on the fundamental accounting equation.

Fundamental accounting equation: Assets = liabilities + shareholders' equity
To start you off on the right foot, here’s a basic example of a balance sheet as well as a template to reference. The template includes a spreadsheet where you can tailor the rows and columns to your needs, such as adding new accounts and changing titles.
Assets are resources your business owns that have future economic value. They are typically categorized by how quickly they can be converted into cash.
Types of assets:
Regularly analyze your accounts receivable turnover to ensure timely customer payments and optimize your inventory turnover to avoid holding excess stock. This can maximize the value of your assets and improve cash flow.
Liabilities represent the debts or obligations your business owes to other parties. Managing these effectively is vital for maintaining a healthy cash flow.
Types of liabilities:
In this section of the report, you will find specific categories, including accounts payable, loans, and variable debts.
Analyze your liabilities to identify opportunities for improvement. Negotiate longer payment terms with suppliers to improve cash flow. Find less expensive financing options available to reduce interest expense.
Shareholders' equity is the amount left over for the owners after all liabilities are subtracted from assets. It represents the company's net value. This section includes the initial capital invested by owners and retained earnings, which are profits kept in the business rather than paid out to shareholders.
Example: Imagine a company with $1 million in assets and $400,000 in liabilities. Its shareholders' equity would be $600,000. This $600,000 could be made up of, say, $200,000 in common stock (the initial investment from shareholders) and $400,000 in retained earnings (profits accumulated over time).
Focus on building retained earnings by consistently generating profits and reinvesting them wisely. This increases your company's intrinsic value and makes it more attractive to investors.

The profit and loss statement, also known as an income statement, summarizes revenues, costs, and expenses incurred during a specific period. Unlike the snapshot view of a balance sheet, the P&L shows performance over time, such as a month, a quarter, or a full fiscal year.
The primary goal of this statement is to show whether a business is profitable. It measures a company's ability to generate sales and manage costs effectively.
In the image below, we can see that all of the sales revenue, expenses, and taxes are listed, equalling the net income for the year. This will later coincide with the balance sheet you previously created in that the net income will appear in the retained earnings line item on the balance sheet.
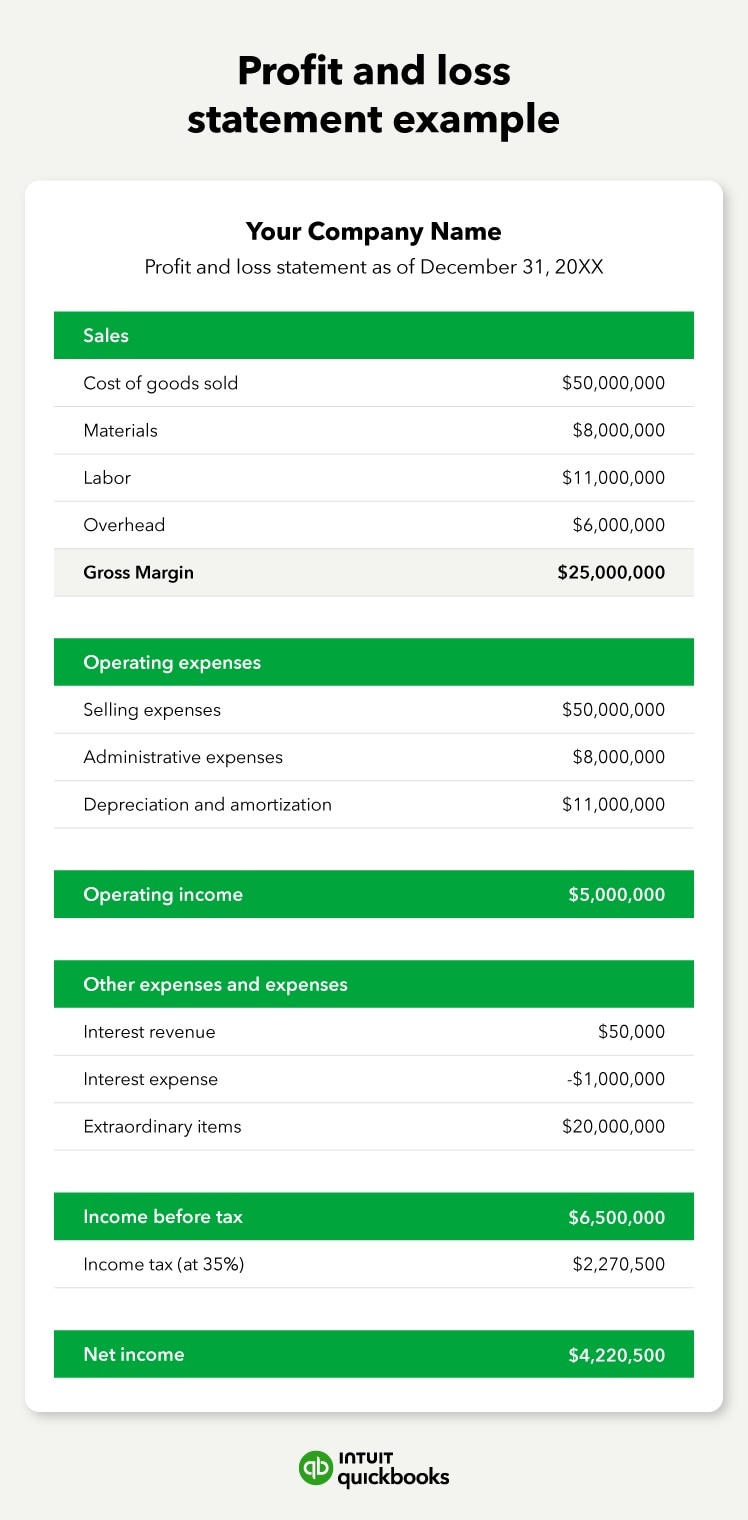
Revenue is the total income generated from your primary business activities. To find your gross profit, you subtract the cost of goods sold. COGS include the direct costs of producing your products, such as raw materials and labor.
These are the costs required to keep the business running that are not directly tied to production.
Examples of operating expenses include:
After subtracting all operating expenses, interest, and taxes from your revenue, you arrive at the net income. This is the bottom line. It shows the actual profit or loss your business made during the period.
Net income = Total revenue - total expenses
While the balance sheet is a snapshot, the profit and loss (P&L) statement is a motion picture. It summarizes your revenue, expenses, and costs to show your total net income over a specific period. This report is the primary tool for measuring your ability to generate profit by either increasing sales or managing costs.
Unlike a balance sheet, the P&L is broken down into several layers that show exactly where your money goes.
What is more important: Profit and loss or balance sheet?
Both are equally important but serve different needs. The P&L is essential for managing daily operations and profitability, while the balance sheet is crucial for understanding long-term stability and net worth.
Everything starts at the top of the statement with the money you bring in. This section tracks your primary sales activity and the immediate costs associated with delivering your products or services.
Review these key components of your initial earnings:
Operating expenses are the costs required to keep your doors open that are not directly tied to production. Categorizing these helps you identify where to cut back.
Monitor these common overhead categories:
Once your gross profit is calculated, the statement moves through several subtotals to reach your final profit. his progression shows how much of your revenue actually stays in the business.
Follow these steps to calculate your final earnings:
Is a balance sheet the same as a profit and loss?
No. A balance sheet shows what a business owns and owes at a specific moment. A profit and loss statement shows the income and expenses over a period of time to determine profitability.
Most businesses generate these reports regularly to maintain financial clarity. A balance sheet and P&L statement can and should be used in different scenarios, depending on the financial period and the need to understand your company’s financial position.
Standard practice for monitoring ongoing health and preparing for tax obligations. The three financial statements (balance sheet, P&L statement, and cashflow statement) are drawn up at the end of your financial period, depending on when you close your books.
Reviewing these statements monthly helps you catch errors early, manage your accounts receivable more effectively, and pivot your strategy if expenses are trending above budget. This consistent cadence ensures you are never surprised by your financial standing at year-end.
Necessary for filing annual taxes and evaluating year-over-year growth. Statements are often prepared again at the end of a full operating cycle.
This year-end review is the ultimate benchmark for your business, providing the data needed to create a financial forecast for the coming year. It allows you to see the big picture of your company's trajectory, helping you determine whether you have reached your long-term financial milestones or need to adjust your business model.
Lenders and investors require both statements to assess your creditworthiness and growth potential. To get a full scope of your company’s financial situation, an investor will likely ask to see your balance sheet to gather how revenue has grown and what debt has been incurred, while using the P&L to figure out your ability to increase profits.
Beyond just looking at the numbers, these stakeholders use these reports to calculate key financial ratios, such as your debt-to-equity ratio or gross margin, to determine the level of risk involved in providing your business with capital.
Required during formal reviews of your financial records to ensure accuracy. Whether an audit is triggered by a government agency, a potential buyer, or internal requirements, having your balance sheet and P&L ready and reconciled is essential.
A clean audit demonstrates that your financial reporting is transparent and compliant with accounting standards, significantly increasing your organization's overall value and credibility.
Mastering your financial statements transforms raw data into a strategic roadmap. By tracking your balance sheet and profit and loss statement together, you gain the clarity needed to manage debt, boost profits, and scale with confidence.
Stop manual tracking and gain a real-time view of your business health. Manage your finances with ease and generate professional reports with QuickBooks today.


Call Sales: 1-800-285-4854