









You could save up to 25% on transaction costs².
Speak with us now to see if you qualify.
Talk to sales 1-800-515-8366
Monday - Friday, 6 AM to 4 PM PT

Table of contents
Table of contents
Finance leaders in scaling wholesale and distribution businesses know that strong reporting underpins healthy margins. As supplier costs shift and inventory absorbs cash, finance needs accurate data to make timely decisions.
Leading distributors rely on analytics to evaluate pricing, inventory, suppliers, and customers in financial terms—not just operational ones. The goal is simple: improve cash flow and support sustainable growth.
This guide outlines five areas where data analytics can strengthen financial performance and working capital. Each section highlights how to translate insights into action when performance shifts
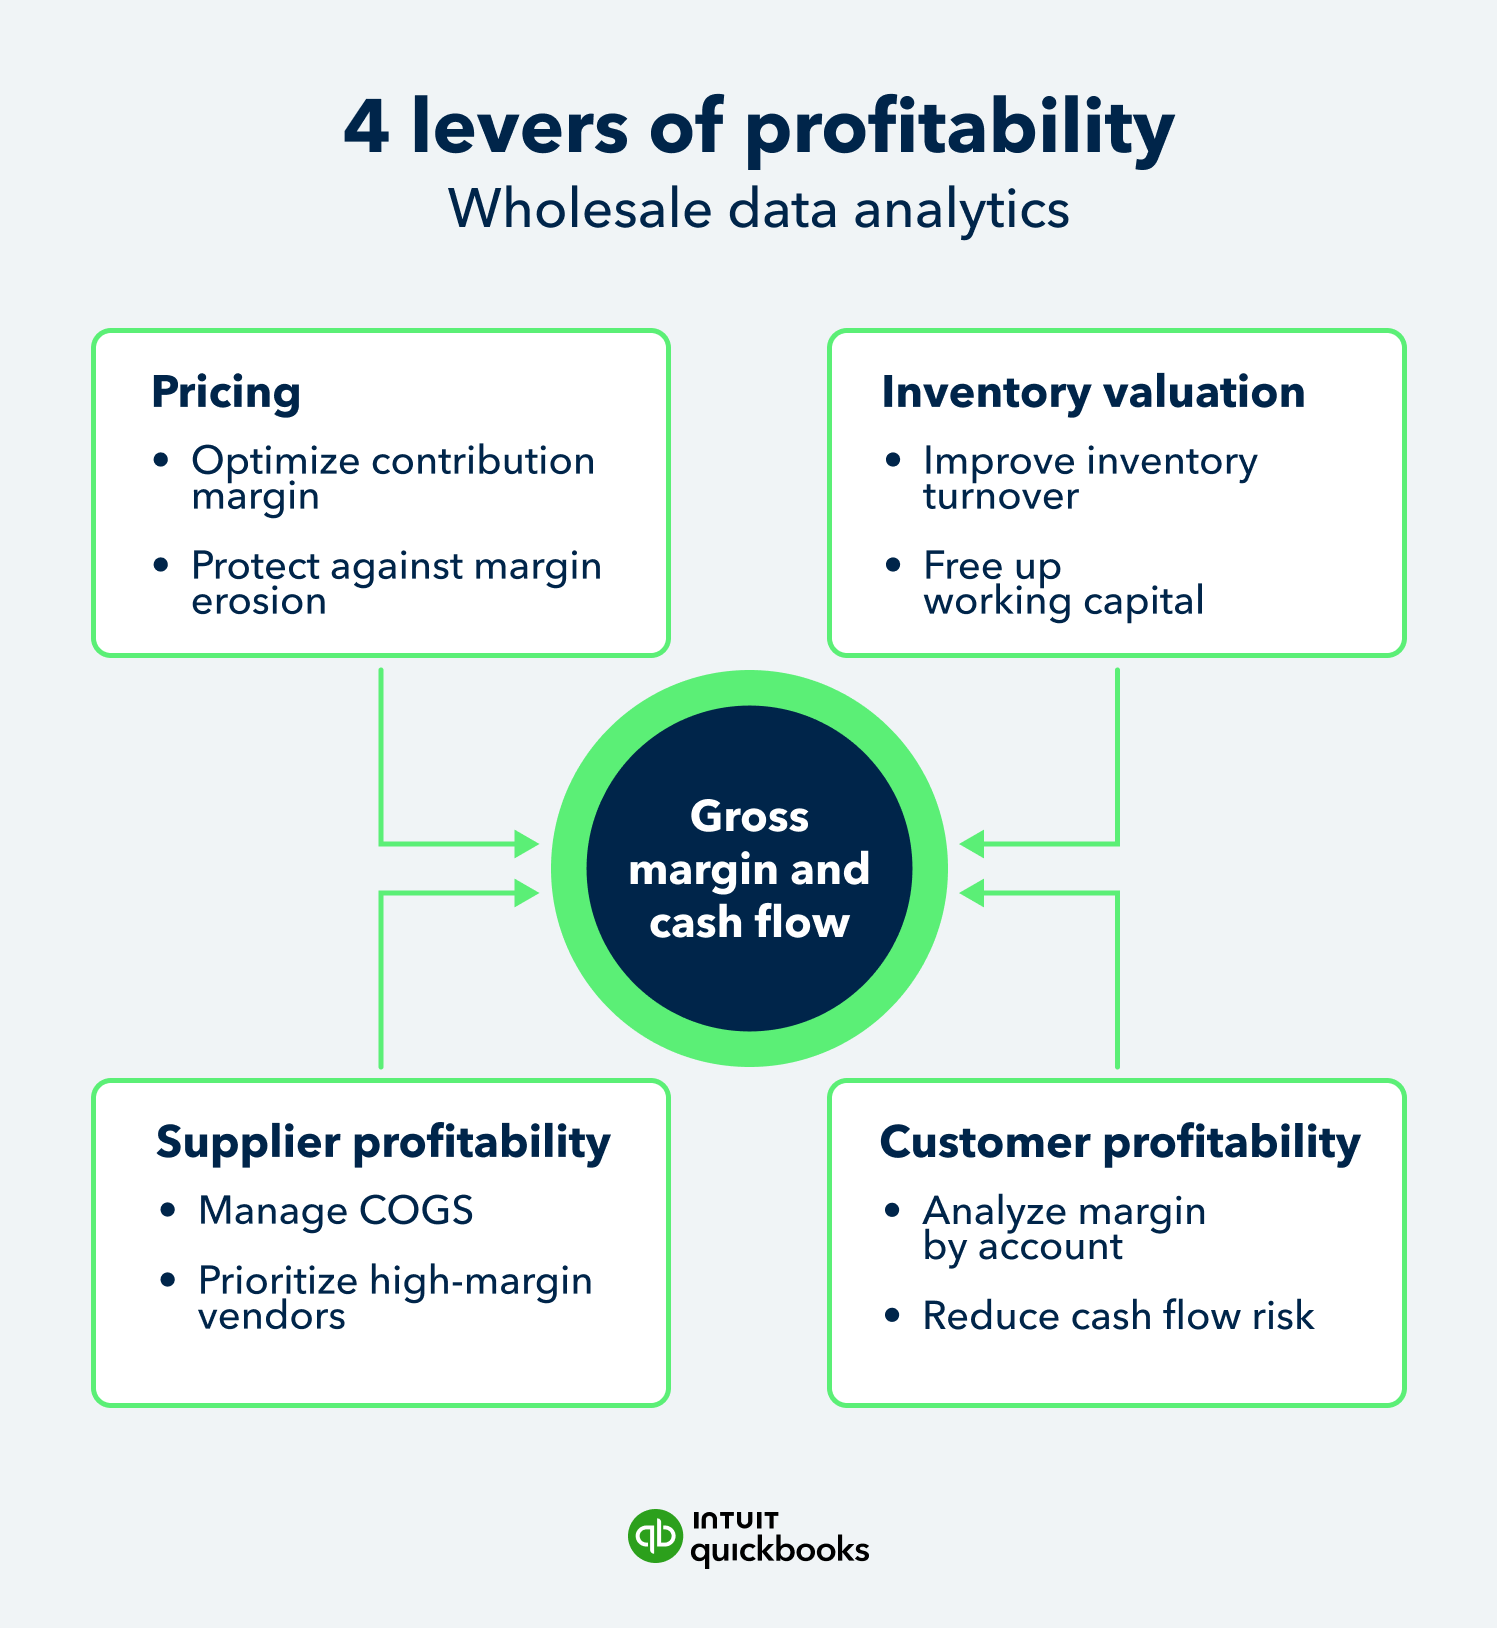
Margin analysis and pricing strategy are central to sustainable growth. Gut-feel pricing is no longer sufficient; supplier cost spikes and discounting can quietly compress contribution without immediate warning. Finance leaders need SKU-, product-, and customer-level reporting to understand what is truly generating earnings.
Break-even analysis adds discipline to pricing decisions. It defines the minimum revenue required to cover fixed and variable costs—calculated as:
For example, if a product line carries a 25% contribution margin and your fixed costs are $1M, you need $4M in sales before it contributes to profit; if it consistently caps out at $2.5M, you either need to raise price, reduce variable costs, or reposition the product.
When calculated by product line, break-even reveals the sales volume required before that line begins contributing to overhead and profit. If performance consistently falls short, finance teams must decide whether to raise prices, reduce costs, or reposition the product to restore contribution.
Break-even shows where a product stops losing money. The real opportunity comes from increasing contribution beyond that point. Finance teams should continuously examine:
Timely reporting ensures pricing and cost shifts are addressed early. With product- and customer-level reporting, tools like QuickBooks Online Advanced help finance teams monitor contribution trends, assess pricing impact, and make adjustments before performance begins to slip.
Move beyond warehouse efficiency—inventory is a financial lever that affects carrying costs, cash flow, and working capital. Excess stock ties up cash, while slow-moving items increase carrying costs and reduce returns.
Inventory is a capital allocation decision. Measuring it in financial terms shows how much cash is committed and how quickly it returns to the business.
Days inventory outstanding (DIO) reflects how long capital is committed to inventory before it converts to revenue. A rising DIO may indicate slower turnover, excess purchasing, or demand shifts affecting working capital. Left unaddressed, a rising DIO can signal mounting capital pressure and reduced liquidity flexibility.
Finance teams use inventory analytics to pinpoint where capital is tied up and what action is needed. That often includes:
Tracking turnover, DIO, and the cash conversion cycle helps finance leaders assess when capital is constrained and when it becomes available for reinvestment.
QuickBooks Online Advanced supports this reporting with customizable KPI dashboards, multi-location inventory tracking, and advanced custom user permissions for finance oversight.
Supplier relationships directly influence profitability in wholesale and distribution. As purchasing volume grows, slight differences in pricing, reliability, and return rates can materially affect gross margin and working capital.
Finance teams should move beyond purchase volume and evaluate suppliers based on contribution to margin and cost stability.
To assess supplier contribution, calculate gross margin per supplier:
This calculation estimates the percentage of overall sales profit tied to products sourced from a specific supplier. When reviewed over time, it highlights which vendors consistently support margin performance and which introduce cost pressure.
Supplier analysis should also consider operational and financial indicators such as:
These indicators translate directly into financial outcomes, affecting cost, margin, and the timing of revenue recognition.
Together, these metrics show how supplier performance affects cost of goods sold (COGS), pricing flexibility, and revenue timing. A supplier that appears cost-effective on paper may reduce profitability if delays or defects increase returns and rework. This may prompt finance teams to renegotiate pricing, shift volume, or replace the supplier to protect margins.
Structured reporting and vendor-level expense tracking help finance teams evaluate supplier impact consistently. This allows purchasing decisions and negotiations to be grounded in measurable financial performance rather than anecdotal experience, enabling faster action when margin pressure emerges.
Revenue growth does not automatically translate into profitability. As customer portfolios expand, finance leaders need to understand which accounts contribute to earnings and which introduce financial risk.
For example, a top-line “hero” account may appear strong based on revenue alone while reducing contribution through heavy discounting, frequent returns, or extended payment terms.
Customer-level analysis should focus on four core areas:
Together, these measures reveal whether revenue strength is translating into financial performance. When it is not, pricing should be adjusted, terms tightened, or the account deprioritized.
Customer-level reporting helps surface patterns that may not appear in aggregate financial statements. Tools such as QuickBooks Online Advanced enable this analysis with customer-level P&L reporting, accounts receivable aging visibility, revenue dashboards, and class or location tracking. With this information, teams are better able to refine customer strategy based on contribution and cash flow impact, and take more targeted action when performance falls short.
As operations grow, the greater risk often lies in accounting errors, not just supply chain disruption. Manual data handling increases the likelihood of misclassified transactions, delayed reconciliation, and reporting inconsistencies that affect financial performance.
For mid-market finance teams, integration is about control. It means aligning purchasing, inventory, sales, and accounting data so reporting reflects financial reality.
Finance-led integration should focus on:
When purchasing systems connect directly to inventory and accounting records, finance gains a consistent view of commitments, costs, and revenue timing. This reduces rework and ensures that financial reporting reflects operational reality.
QuickBooks Online Advanced supports this level of coordination with workflow automation, custom user permissions, batch invoicing, revenue recognition tools, and integrated reporting dashboards. It helps growing businesses maintain reporting accuracy as transaction volume increases.
Wholesale finance teams managing multi-location inventory, supplier cost shifts, and high transaction volume need more than standard reporting. QuickBooks Online Advanced provides the depth and structure required to analyze margin, working capital, and vendor performance with greater precision.

Monitor stock levels and movement by warehouse, improving allocation decisions and reducing imbalances that affect working capital.
Analyze contribution, margin, and cash flow trends by product, supplier, and customer to support data-driven pricing and purchasing decisions.
Establish stronger financial controls by defining approval thresholds and limiting access to sensitive transactions.
Align revenue reporting with transaction timing, helping finance maintain accuracy as sales structures become more complex.
Process higher transaction volumes efficiently while evaluating supplier costs and their impact on profitability.
In wholesale and distribution, financial results reflect the quality of everyday decisions—pricing, purchasing, inventory levels, and customer terms. When those decisions are guided by structured reporting instead of assumptions, finance gains the ability to adjust before small issues become costly patterns. That includes acting quickly on pricing, supplier, and customer changes to protect margin and cash flow.
Data analytics brings pricing, supplier performance, inventory liquidity, and customer contribution into one financial view. That alignment allows leadership to strengthen returns, improve cash flow, and support steady growth.
Ready to see the impact of real-time financial reporting and analytics? Start a free trial of QuickBooks Online Advanced to help support your margin oversight and working capital management.

Call Sales: 1-800-285-4854