Our latest Small Business Insights report looks at the big issues facing U.S. small businesses today, starting with inflation, hiring, and the ongoing economic recovery from COVID. Dive into the key findings below by using the chapter links.

Small Business Insights: Inflation and hiring challenges force small businesses to react
Inflation
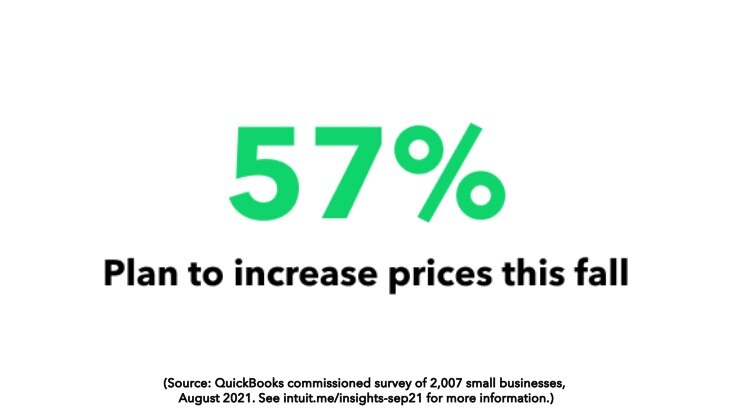
Most small businesses (96%) are concerned about inflation. The top three cost pressures are materials, equipment, and labor. This may be why almost three out of five small businesses (57%) want to raise prices this fall.1
Hiring
Most small business workforces continued to grow in August, but the overall rate of growth has slowed since June. Workforces are currently growing fastest in the information industry, which includes software development. Wages are currently rising fastest in public administration organizations which oversee government programs.2
Recovery
The economic recovery from COVID became more widespread through June and July. Even some of the hardest-hit businesses — including restaurants, clothing stores, and hair studios — are bouncing back. But many travel and entertainment businesses are still struggling.3
Risks
Despite high levels of optimism, small businesses still see the economy as their number one threat today. Rising costs and low demand are creating cash flow problems for some.1
Adaptation
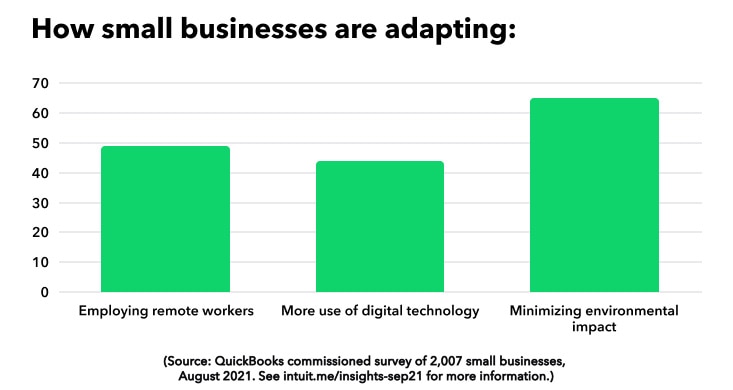
Almost half of small businesses (49%) have remote workers and the number looks set to grow. Almost four out of five (79%) say that investing in digital technology makes them more likely to succeed.1
Growth
Almost two-thirds of small businesses (65%) predict their business will grow this fall. Ecommerce businesses continue to be more upbeat than businesses which do not sell online.1
Up next, a deeper dive into inflation. Use the chapter link to jump to the next section.
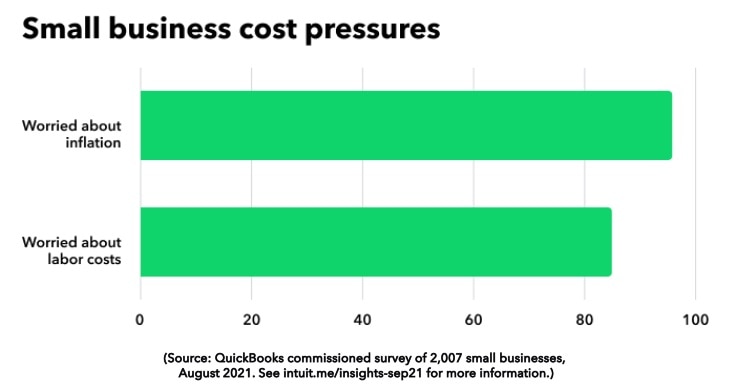
More than 9 out of 10 small businesses are concerned about inflation
New data1 from a recent survey commissioned by QuickBooks reveals the top three cost pressures small businesses face today are:
- Materials
- Equipment
- Labor
Overall, more than nine out of 10 small businesses (96%) are concerned about inflation. More than four out of five (85%) are concerned about the cost of labor. Despite this, many have recently increased wages2 to tackle skills shortages. Our research suggests this trend will continue. Read more about this in the Hiring section.
Almost three out of five small businesses plan to increase prices
Perhaps in response to rising costs, almost three out of five small businesses (57%) say they will “definitely” or “potentially” raise prices this fall. Just 1 in 3 (33%) have no plans to make any price increases. For some, higher input costs are already contributing to cash flow problems. Read more about this in the Risks section.
Revenues are returning to pre-pandemic levels
In the face of rising costs, there is good news. QuickBooks customer data3 reveals that nationally, small business monthly revenues consistently beat their pre-pandemic benchmarks every month from February to July 2021. Since May, the recovery has become more widespread. Read more about this in the Recovery section.
Up next, Hiring. Use the chapter link to jump to the next section.
Most small business workforces continued to grow in August
QuickBooks Payroll data2 reveals that small business workforces grew from July to August 2021 in all but four industries (construction, finance and insurance, utilities, and public administration).
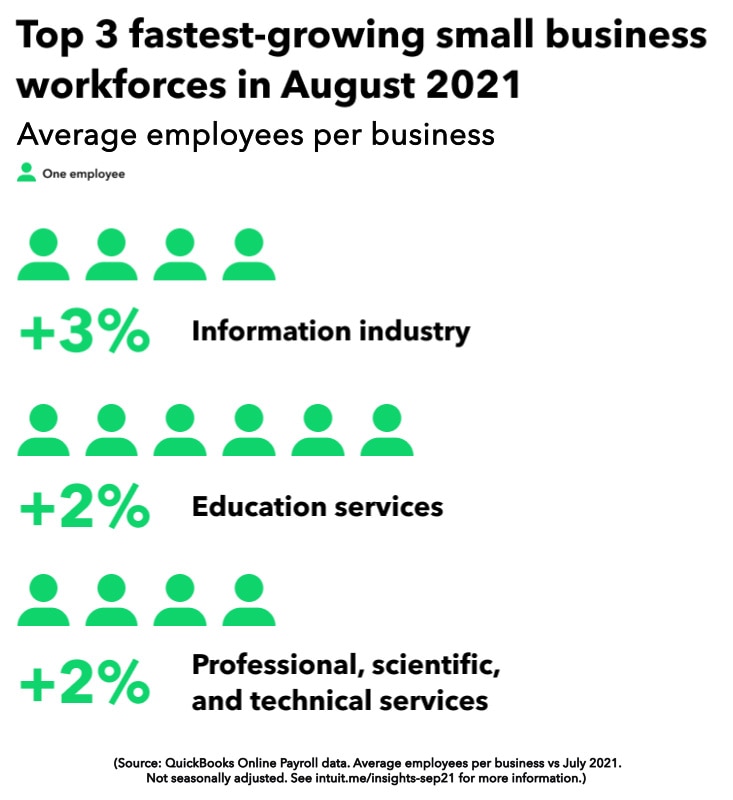
The three fastest growing small business workforces from July to August 2021 were:
- Information, e.g. software development (+3%)
- Education, e.g. schools and training centers (+2%)
- Professional, scientific, and technical services, e.g. lawyers, accountants, engineers, and architects (+2%)
Overall, the trend for small business hiring has been positive since March 2021 — but the rate of growth did slow through the summer months, potentially due to the impact of the Delta variant of COVID-19. The biggest gains since March 2021 have been in arts and entertainment, agriculture, and accommodation and food services.
Hourly pay rose fastest for real estate and public administration workers in August
Hourly pay went up in 10 industries from July to August 2021. The three industries that saw the biggest increases were:
- Public administration organizations which oversee government programs (+3% to $15.81/hour)
- Real estate, which includes rental and leasing as well as sales of property or equipment (+2% to $17.87/hour)
- Information, such as software developers (+2% to $18.00/hour)
If we look further back to see how hourly wages have changed over the past 12 months, we find that accommodation and food service workers have seen the largest pay increases. Between September 2020 and August 2021, median hourly pay increased by more than 8% — from $12 to $13. At the other end of the scale, median hourly pay has not changed at all over the past 12 months in the arts and agriculture industries.
Which workforces contracted most during the pandemic?
By comparing average employee numbers in August 2021 against their pre-pandemic benchmarks in August 2019, we find that just four industries currently have smaller workforces than they did before the pandemic:
- Public administration organizations which oversee government programs (-3% vs pre-pandemic benchmark)
- Transport and warehousing, which includes passenger transport as well as cargo (-2% vs pre-pandemic benchmark)
- Management companies, such as holding companies and companies which advise and own stocks in other businesses (-2% vs pre-pandemic benchmark)
- Other services, such as repair and personal services (-2% vs pre-pandemic benchmark)
The three industries with the most growth over that period are:
- Professional, scientific, and technical services, e.g. lawyers, accountants, engineers, and architects (+5% vs pre-pandemic benchmark)
- Construction (+4% vs pre-pandemic benchmark)
- Retail (+4% vs pre-pandemic benchmark)
August was the first month during the pandemic in which accommodation and food service workforces returned to their pre-pandemic levels. The low point was in April 2020, when the average small business workforce was 17% smaller than the pre-pandemic benchmark (in April 2019).
More than 1 in 2 small businesses face skills shortages
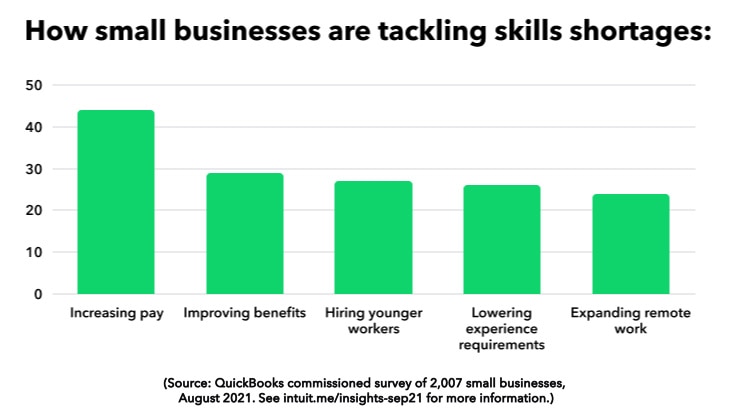
Returning to the data we collected in the survey we recently commissioned1, we see that more than half of small businesses (51%) say it’s getting harder to hire skilled workers. Similarly, more than two in five (42%) say it’s getting harder to retain skilled workers. To address this, they are doing more than simply raising pay:
- 29% are offering more benefits
- 27% are hiring younger workers than before
- 26% are relaxing experience requirements
Looking ahead, almost one in two (48%) small businesses say they will increase pay for their existing workers during the next pay review. Two in five (40%) will offer larger bonuses.
Up next, Recovery. Use the chapter link to jump to the next section.
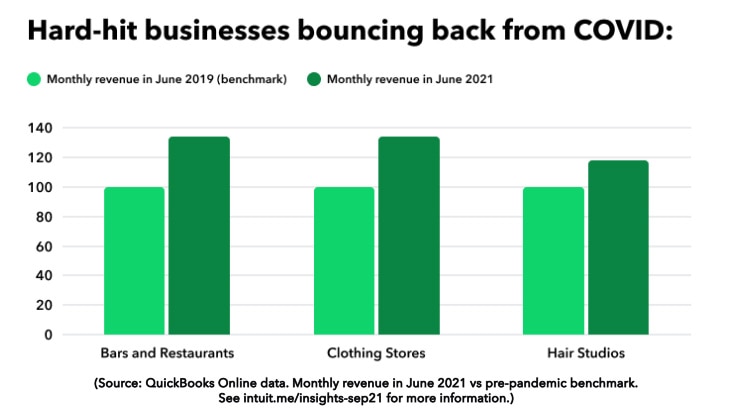
Small business recovery is taking hold
QuickBooks data3 reveals even some of the hardest-hit small businesses saw monthly revenues return to their pre-pandemic levels this summer. Nationally, monthly revenues were 25% higher in June than their pre-pandemic benchmark. In July, they were 6% higher. The drop may be due to the impact of the Delta variant of COVID-19.
Businesses that benefited most from the June uptick include:
- Bars and restaurants: monthly revenues were up 34% compared to their pre-pandemic benchmark, equivalent to an extra $14,000 per business. This almost put them in the top 10 best performing industries nationally for the month. Last year, in June 2020, they were in the bottom 10.
- Clothing and accessory stores: monthly revenues were up 34% compared to their pre-pandemic benchmark, equivalent to an extra $6,000 per business. Like bars and restaurants, they were very close to being in the top 10 best performing industries nationally. That’s a huge turnaround from April 2020 when they were in the bottom 10.
- Hair studios: as previously reported, hair studios were among the hardest-hit of all small businesses in April 2020, when the pandemic’s economic impact was most severe. But through both June and July 2021, monthly revenues were back to pre-pandemic levels. In June they were up by 19%, equivalent to an extra $3,000 per business.
Travel, tourism, and entertainment business still struggling
Some small businesses, however, have not seen their monthly revenues get anywhere close to their pre-pandemic levels yet. These include:
- Travel agencies: monthly revenues were 25% below their pre-pandemic benchmark in July 2021, equivalent to $3,000 less per business.
- Tour operators: monthly revenues were 24% below their pre-pandemic benchmark in July 2021, equivalent to $3,000 less per business.
- Theater producers: monthly revenues were 13% below their pre-pandemic benchmark in July 2021, equivalent to $1,000 less per business.
Finance, real estate, and construction businesses still going strong
The finance, real estate, and construction industries have been highly resilient during the COVID-19 pandemic. When we first looked at COVID’s impact on small business revenues back in April 2021 (read the original report here), we found that annual revenues for finance and insurance business had gone up by 14% during the first 12 months of the pandemic — the largest increase of all. There was also clear evidence of an increase in demand for construction and home improvement projects.
The latest monthly revenue data, from July 2021, tells a similar story.
- Investment advisors: 25% increase in monthly revenue compared to their pre-pandemic benchmark, equivalent to an extra $7,000 per business.
- Mortgage bankers: 28% increase in monthly revenue compared to their pre-pandemic benchmark, equivalent to an extra $7,000 per business.
- Title abstract companies (property records): 29% increase in monthly revenue compared to their pre-pandemic benchmark, equivalent to $11,000 per business.
- Special trade contractors (e.g. home improvement): 14% increase in monthly revenue compared to their pre-pandemic benchmark, equivalent to $4,000 per business.
Up next, Risks. Use the chapter link to jump to the next section.
Small businesses say the economy remains their No.1 threat
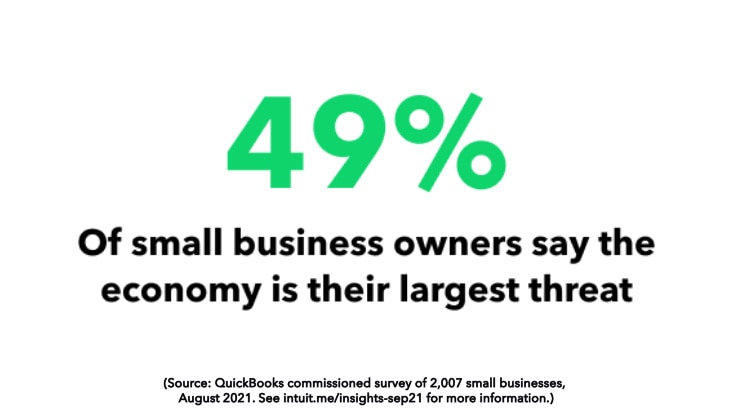
Despite signs of a more widespread economic recovery from COVID (see Recovery section), in the recent survey we commissioned1 almost 1 in 2 small businesses (49%) said the economy is still a potential risk.
The top three threats they identified are:
- The economy (49% agree)
- Rising costs (40% agree)
- Low-price competitors (24% agree)
Rising costs cause cash flow problems and slower growth
Overall, almost three in five small businesses (58%) currently have a cash flow problem. They say this is limiting their ability to grow, take on new projects, and make capital investments. Some say it’s preventing them from hiring.
The top three causes of cash flow problems today are:
- Low customer demand (27% agree)
- Costs rising too fast (26% agree)
- Unpaid invoices (9% agree)
Low revenue businesses are under the most pressure. Almost a third (29%) of small businesses with less than $50,000 in annual revenue say cash flow is currently a major problem.
Low cash reserves are another risk factor
Almost three in five small businesses (57%) currently have less than six months of cash reserves. As with cash flow, the most vulnerable are again those with less than $50,000 in annual revenue. More than one of four of these businesses (26%) currently have less than one month of cash reserves to cover their costs in an emergency.
Up next, Adaptation. Use the chapter link to jump to the next section.
Small businesses are embracing remote work
The recent survey we commissioned1 reveals that almost half of small businesses (49%) now have remote workers. Of these, more than a third (36%) say the number will grow. Just one in ten (12%) predict a smaller remote workforce in future. Urban businesses that sell online are the most likely to have remote workers. Two-thirds (66%) of these businesses say they have a remote workforce compared to roughly a third (37%) of rural businesses.
Digital technology and accountants help small businesses to thrive
Almost four out of five small businesses (79%) agree they are more likely to succeed if they invest in digital technology. More than two in five (44%) want to make more use of digital technology in their business.
Accountants also help small businesses to succeed. According to our survey respondents, the top three benefits accountants are bringing to their business are:
- Better business decisions
- Saving money
- More likely to survive
Most small businesses want to protect the environment
Almost nine out of 10 small businesses (86%) agree that environmental sustainability is important to the future of the economy. More than 2 in 5 (44%) say it is “critically important.” Millennials, urban businesses, and younger businesses (established less than two years ago) expressed the most support for sustainability.
Two-thirds of small businesses (65%) want to minimize their environmental impact. More than 1 in 2 (52%) would do more if they had more help.
Up next, Growth. Use the chapter link to jump to the next section.
Small businesses are upbeat about growth and the economy
The survey we recently commissioned1 reveals that almost two-thirds of small businesses (65%) predict their business will grow this fall. Among businesses which sell online, this rises to 70%. But among businesses which do not currently sell online, this drops to 58%.
Similarly, three out of five (60%) small businesses are currently “somewhat” or “very” optimistic about the economy. But as we’ve seen elsewhere in this report (see Risks section), lower revenue businesses have different views. Those with less than $50,000 in annual revenue were far less optimistic than businesses with more than $1 million in annual revenue. Ecommerce businesses also expressed higher levels of optimism.
To boost growth, small businesses need more workers
Almost one in two small businesses (47%) need more workers. Many identify hiring as a top growth priority. One in ten (10%) want to significantly expand their workforce this fall. Urban businesses have the most appetite for hiring, with more than three out of five (58%) needing more workers right now.
Other growth priorities include:
- Improving marketing results (42% agree)
- Increasing online sales (42% agree)
- Developing new products/services (33% agree)
Many will continue raising pay to address hiring challenges
As we’ve seen (see Hiring section), one in two small businesses (51%) are finding it harder to hire skilled workers and more than two in five (42%) are struggling to retain skilled workers. QuickBooks Payroll data2 confirms that many have already increased pay. Based on our recent survey, this trend looks set to continue:
- More than two in five small businesses (44%) are raising wages for new hires.
- Almost 1 in 2 small businesses (48%) will use their next pay reviews to give more money to existing employees.
- Two in five small businesses (40%) will offer existing employees larger bonuses in their next pay reviews.
Up next, Data Sources. Use the chapter link to jump to the next section.
1. Survey data
QuickBooks commissioned Qualtrics to survey 2,007 small business owners and decision makers throughout the U.S. in August 2021. Respondents’ businesses have up to 100 employees and more than $5,000 in annual revenue. Roughly a third (36%) are brick-and-mortar businesses. The remainder are omni-channel, multi-channel or primarily online. Around one in five (18%) are located in rural areas while the remainder are in urban or suburban locations. Percentages have been rounded to the nearest decimal place. Respondents received remuneration.
2. QuickBooks Payroll data
This is not survey data but anonymized, aggregate data from 200,000 small businesses that use QuickBooks Online Payroll to manage their payroll. Businesses that have used QuickBooks Online Payroll for less than four months were excluded from the dataset. All hourly wages are expressed as median values. Contractors and salaried employees were excluded from hourly wage calculations. Contractors and salaried employees are included in average employee calculations.
Monthly workforce growth rates
Monthly workforce growth rates are calculated by comparing the average number of paid employees per business for the current month against the average number of paid employees per business for the previous month (e.g. August 2021 vs July 2021). For example, if the average number of employees goes up from 5 to 6 from one month to the next, the monthly increase is 20%. The data is not seasonally adjusted.
Pre-pandemic benchmarks
The pre-pandemic benchmarks used in this section of the report compare monthly payroll data during the pandemic against monthly payroll data from the corresponding month before the pandemic (e.g. July 2021 vs July 2019).
Industry classifications
For this analysis, businesses were grouped using the North American Industry Classification System (NAICS), which has 20 categories. See the U.S. Census Bureau website for more information.
3. QuickBooks Online data
This is not survey data but anonymized, aggregate data from around 1 million small businesses that use QuickBooks to manage their business. The exact number of businesses in the overall sample fluctuates over time on a monthly basis from a low of 800,000 small businesses to a high of around 1.1 million because it excludes businesses that do not have corresponding monthly data year over year. The annual revenue analysis also excludes any businesses with less than 10 months of corresponding data available year over year. QuickBooks Online customers who have not connected their business bank accounts were also excluded from the analysis. Consequently, this report only includes businesses that had deposits in their accounts during the given timeframes. Median values are used throughout in place of mean (average) values to eliminate outliers that can skew the data.
Net bank deposits
The financial impact of COVID-19 is measured by comparing small businesses’ net bank deposits during the pandemic with the same data from the same businesses before the pandemic to reveal how things have changed for them year-over-year. Net bank deposits are incoming deposit transactions into small business bank accounts. This excludes non-operating deposits such as business loans and government assistance (for example, Paycheck Protection Program loans, also known as PPP). All of this data is anonymized and aggregated.
The net bank deposit data was used to calculate a monthly median year over year net deposit ratio (YOY revenue ratio) — referred to as “monthly revenue benchmarked to pre-pandemic monthly revenue” — which provides directional insights into small business revenues and recovery. The YOY revenue ratio is calculated as follows:
For each available business, calculate the YOY net deposit ratio by dividing the current month’s net deposit dollar amount by the corresponding month before the pandemic.
For each month, aggregate by taking the median YOY net deposit ratio among all available businesses for the relevant segment. For example, a YOY revenue ratio of 85% for a given month means that:
- 50% of companies’ net deposits are less than 85% of the corresponding month before the pandemic.
- 50% of companies’ net deposits are greater than 85% of the corresponding month before the pandemic.
- YOY revenue ratio was then overlaid with industry and geographic data to reveal the patterns of small business recovery between April 1, 2020 and March 31, 2021.
Industry classifications
For this analysis, businesses were grouped using SIC (Standard Industrial Classification) categories, with 10 sectors (agriculture; construction; finance/insurance; manufacturing; mining; public administration; retail; services; transportation, communication, energy, & sanitary; and wholesale), comprising smaller industry categories (known as SIC2) and sub-industry categories (known as SIC4).
Annual revenue data
As described above (see “Net bank deposits”), annual revenues are estimated from anonymized, aggregate net bank deposit data. Annual revenues during the pandemic are benchmarked against the corresponding 12 months before the pandemic. In other words, annual revenue data from April 1, 2020 to March 31, 2021 is compared against annual revenue data from April 1, 2019 to March 31, 2020 from the same group of businesses.
Monthly revenue data
As described above (see “Net bank deposits”), monthly revenues are estimated from anonymized, aggregate net bank deposit data. Monthly business performance during the pandemic is then benchmarked against data from the corresponding months before the pandemic (for example, July 2021 vs. July 2019) from the same group of businesses.
Data limitations and considerations
The calculation of year-over-year revenue change required that any business included in the analysis have bank data for 2021, 2020, and the same months in the pre-pandemic years. Businesses were excluded if they had only recently connected bank data to QuickBooks or lost their bank connection within the one-year period.
A consideration of survival bias caused by businesses who discontinued operation or/and disconnected bank accounts during COVID-19 is also necessary. For example, the percentage of businesses that lost bank connections in 2020 (8%) is close to that in 2019 (7%), which means COVID-19 didn’t significantly increase the number of disconnected bank accounts in our data sample. Thus, the data is still comparable year-over-year without significant bias.
Net deposit data is only a proxy for business revenue and may sometimes over- or underestimate the true business revenues because this may include non-revenue deposits, such as equity or loan transfers from other bank accounts not linked to QuickBooks. The majority of these were identified and removed by a transaction tagging algorithm. Another potential limitation is that businesses may have only connected one of their business bank accounts in QuickBooks, which would only provide partial insights of their net deposit activity.


