Accurately measuring metrics that correlate with growth and profitability are essential to ensuring the sustainable financial health of your business. But with changing business models and compressed production cycles, traditional metrics like earnings per share (EPS) or revenue growth are no longer adequate to give you a clear picture of your company’s financial wellbeing.
Home Depot, for example, experienced falling share prices over a five-year period in the early 2000s. Despite poor stock performance, Home Depot’s debt and equity market value was $88 billion at the end of 2003. With $29 billion invested in operating capital, their market-value added (MVA), which measures the difference between the market value of a Home Depot’s debt and equity and the amount of capital invested, was $59 billion. By this metric Home Depot was the second healthiest retailer in the country behind Wal-Mart.
In the same way that EPS can be a lagging indicator of overall financial health, strong revenue growth does not always indicate higher profitability.
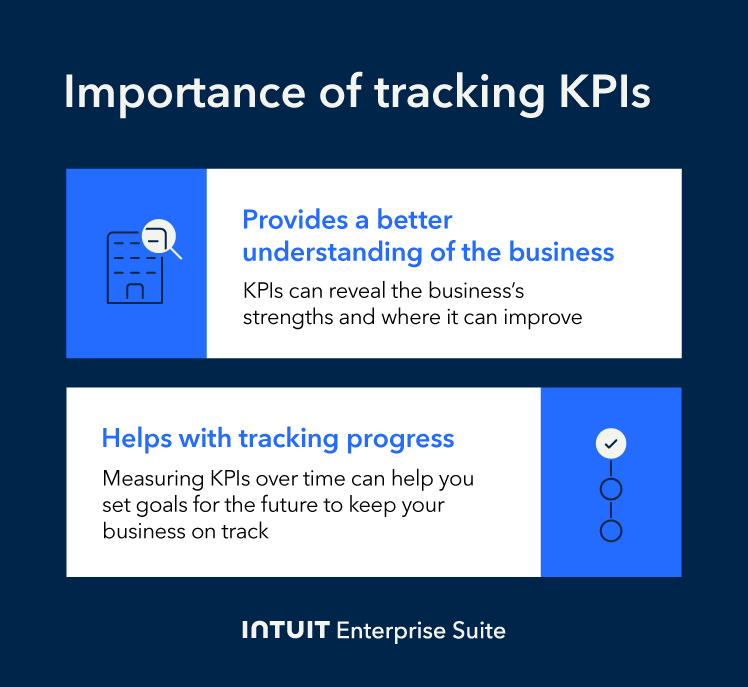
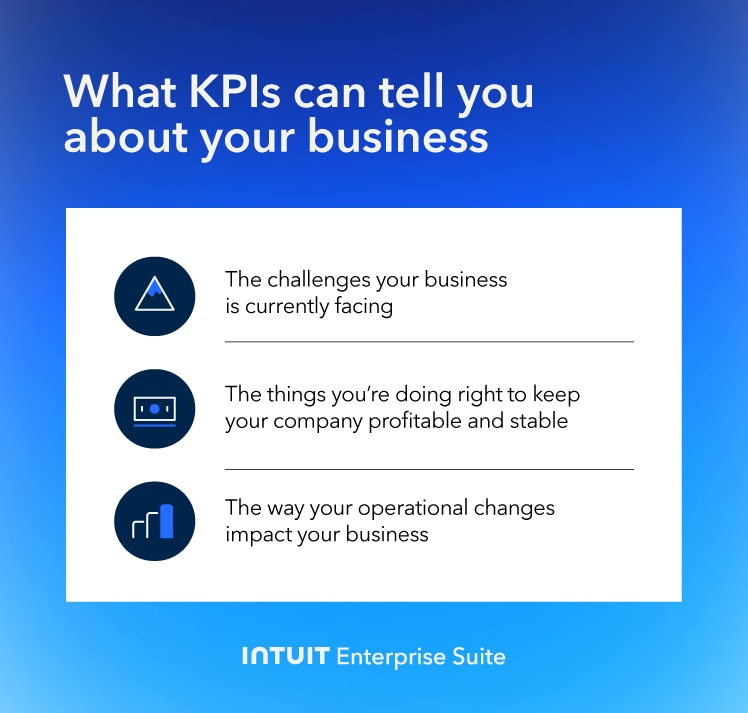
To get a more refined understanding of your business’s performance and the factors that contribute to or inhibit growth, you’ll need to peel the onion back a few layers.
What is a KPI?
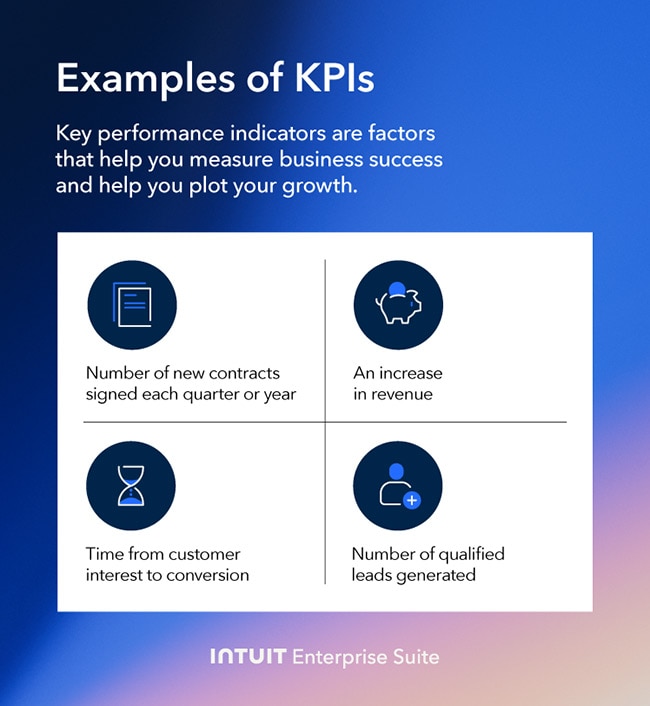
A KPI, or a key performance indicator, is a quantifiable measure used to track performance toward a defined strategic objective. Used to support overall organization goals, the best KPIs serve as clear targets or milestones to reach as a team moves forward.
The most common KPI reports include operational processes, customers, or financial KPIs. For example, a manufacturing business KPI could be achieving a production throughput of 5,000 units per day. Or an ecommerce marketing KPI could be improving their conversion rate by 10% within the quarter.
To be effective, an attainable KPI should focus on a goal to achieve within a specific timeframe and provide a measurable way to track business performance toward that goal.
The 6 types of KPIs
While KPIs are tied to a company’s strategic objectives, they largely depend on the type of company and industry. These six KPIs can help you lay bare the realities of your business’s growth, or lack thereof, and help you improve your bottom line with superior business insights.
1) Contribution margin
Contribution margin represents the incremental money generated from each product or unit sold after deducting your firm’s variable costs. Calculate contribution margin by subtracting variable costs from sales revenue. To get a percentage, divide by sales revenue and multiply by 100.
Contribution Margin = ((Product Sales Revenue – Product Variable Costs Per Unit) / Product Sales Revenue)) x 100%
The equation intentionally leaves out operating costs so you can see how profitable individual products are. This metric can help guide your pricing strategy, product mix, advertising spend, and inventory planning.
Whether you are in the manufacturing business or operate an ecommerce store, with a fine-tuned contribution margin, you can look at profit and loss (P&L) on a weekly or even daily basis and use the results to create more accurate demand forecasts.
Emazing Group, a successful ecommerce solution for consumer lifestyle brands, has managed to do just this. Using a contribution margin dashboard with data from sales channels, gross margin, and variable expenses, their team can see how much money they make off each sale, after considering varying customer acquisition costs.
With this refined P&L information at your disposal, your team can make more informed decisions on marketing campaigns and promotions, as well as identify profitability issues and make timely corrective actions.