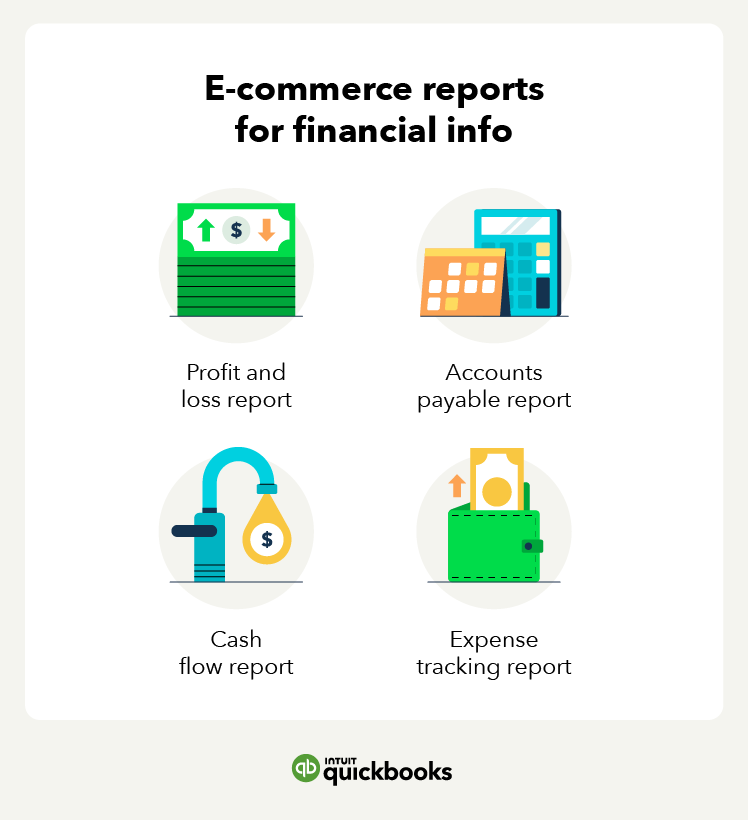
20. Profit and loss report
- What it tells you: Your net income or loss
- What it includes: Revenue, expenses, net income
The profit and loss report, also known as an income statement, shows how much money your business earns or loses over a specific time. It displays the difference between your total income and total expenses. The profit and loss statement will help you evaluate your business's performance, profitability, and financial health.
What you can find on the profit and loss report:
- Revenue: The money you earn from selling products or services to customers.
- Expenses: The money you spend producing or delivering products to customers. Includes materials, labor, overhead costs, and other costs.
- Net income: Revenue minus all other expenses and taxes.
A profit and loss report shows your business's overall profitability. It helps you evaluate your business's financial performance and health.
Accounting software like QuickBooks can help you gather insights across multiple channels for accurate financial reporting.
21. Accounts payable report
- What it tells you: How much you owe suppliers
- What it includes: Accounts payable turnover and aging
An accounts payable report shows you the money your business owes suppliers for goods and services purchased on credit. It helps track coming cash outflows, liabilities, and payment obligations. Managing payables can improve cash flow, supplier relationships, and credit.
Key components of accounts payable reports are:
- Accounts payable aging: This part of the report will show unpaid bills by due dates. It also shows how long bills have been outstanding and amounts overdue.
- Accounts payable turnover: Measures how fast you are paying your bills. It also shows how often you pay accounts payable in a period.
The accounts payable report can help you prioritize payments to avoid fees, penalties, or reputational damage.
22. Cash flow report
- What it tells you: Your net cash flow
- What it includes: Cash in and outflows
A cash flow report shows how much money your business has at any time. It lists the cash coming in and going out during a period like a month or a year. It will help you manage your business's liquidity.
Some of the key parts of a cash flow report are:
- Operating activities: Shows cash from core operations like sales and paying suppliers and employees.
- Investing activities: Shows cash spent or received for investing, like buying or selling assets.
- Financing activities: Shows cash from debt or equity.
Tracking cash over time shows potential shortages or surpluses, future needs, and ways to optimize cash flow projections.
23. Expense tracker report
- What it tells you: How much your spending in key areas
- What it includes: Expenses by category and time period
An expense tracker report shows you how much money you spend on various categories and items for your e-commerce store. For example, you can group marketing or supplies expenses. Some of the key features of an expense tracker report include:
- Dividing expenses into different categories based on their purpose
- Tracking expenses over a certain time period, such as peak season
- Viewing record keeping for expenses, such as receipts or invoices
An expense tracker report helps you gain insight into your spending patterns and behaviors. By analyzing your expenses over time, you can identify areas where you can save money or spend more wisely.
Tips for putting your e-commerce reports to work
The e-commerce world is booming, and with effective data analysis, companies can make informed choices to stay ahead of competitors. These e-commerce reports provide valuable insights into what's working and what isn't, allowing you to fine-tune strategies for success. Here are some tips for analyzing your e-commerce reports:
Tap into user-driven tools
You can utilize user-driven tools and methods to understand how visitors to your e-commerce website interact with the website and what motivates or prevents them from making a purchase.
Some common user-driven tools to analyze:
- Heat maps and session recordings: These can show you how users navigate your store and where they click.
- Surveys: These provide direct feedback from your users about what they like or dislike and what is confusing or frustrating.
You may discover that users can't find certain products or abandon their carts at a particular point in the checkout process. Or, you may learn that you need to relabel content or change image sizes.
Don’t be afraid to experiment
Experiment with different parts of your e-commerce store, such as product descriptions, images, prices, discounts, and reviews to see increases in conversions.
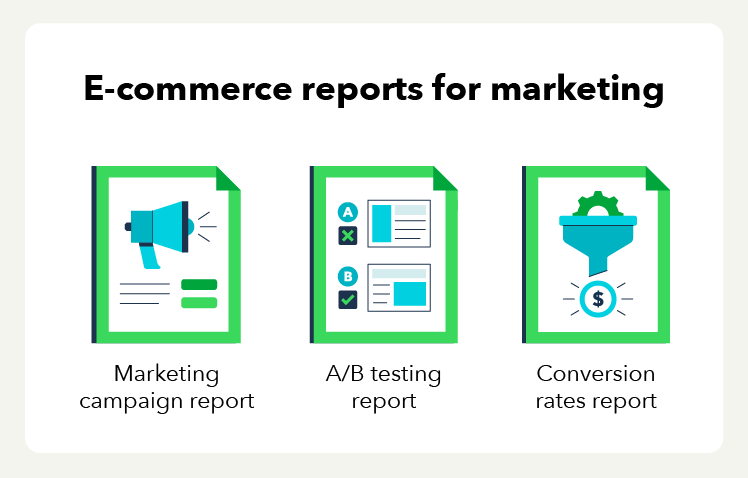
A/B testing is a great way to experiment with different elements on your e-commerce site. You can test multiple versions of product pages, category pages, the checkout process, and emails to see which options resonate most with your users.
Some things you may want to A/B test include:
- Prices
- Product descriptions
- Checkout process
- Shipping methods and costs
- Product images
- Follow-up emails
Continuously experimenting and optimizing your e-commerce site based on data insights is key to improving the user experience and driving more conversions. A/B testing different elements at scale can lead to significant revenue gains over time.
Leverage data
You can use data you get from the reports above, such as purchase history and search requests, to predict what customers want or what inventory you need more of.
Using historical sales to make predictions can help you optimize inventory levels and avoid overstocking. This allows you to forecast future needs and adjust inventory to meet demand.
Analyzing metrics like traffic and sales can give you a look into the life cycle of your products and seasonality. Key metrics that provide insight here are monthly and yearly traffic and revenue trends, as well as trends in conversions and average order value.
Analyze everything that matters
You’ll want to start by analyzing your e-commerce store's sales and traffic sources to determine which channels drive the most revenue and conversions. Then allocate your marketing budget accordingly.
However, while analyzing sales by channel and traffic source is critical, don't rely solely on sales and traffic. Look at customer demographics and behavioral insights to gain a deeper understanding of your audience.
See what products and content they engage with most and their preferred shopping channels. This extends to assessing your social media performance by tracking metrics such as reach, engagement, and return on ad spend. And lastly, stay up-to-date on e-commerce trends, as they change quickly.
Run your business with confidence
Have one accounting and e-commerce platform to manage it all—manage orders, inventory, and bookkeeping conveniently in one place by syncing sales data from your sales channels to QuickBooks Online.
