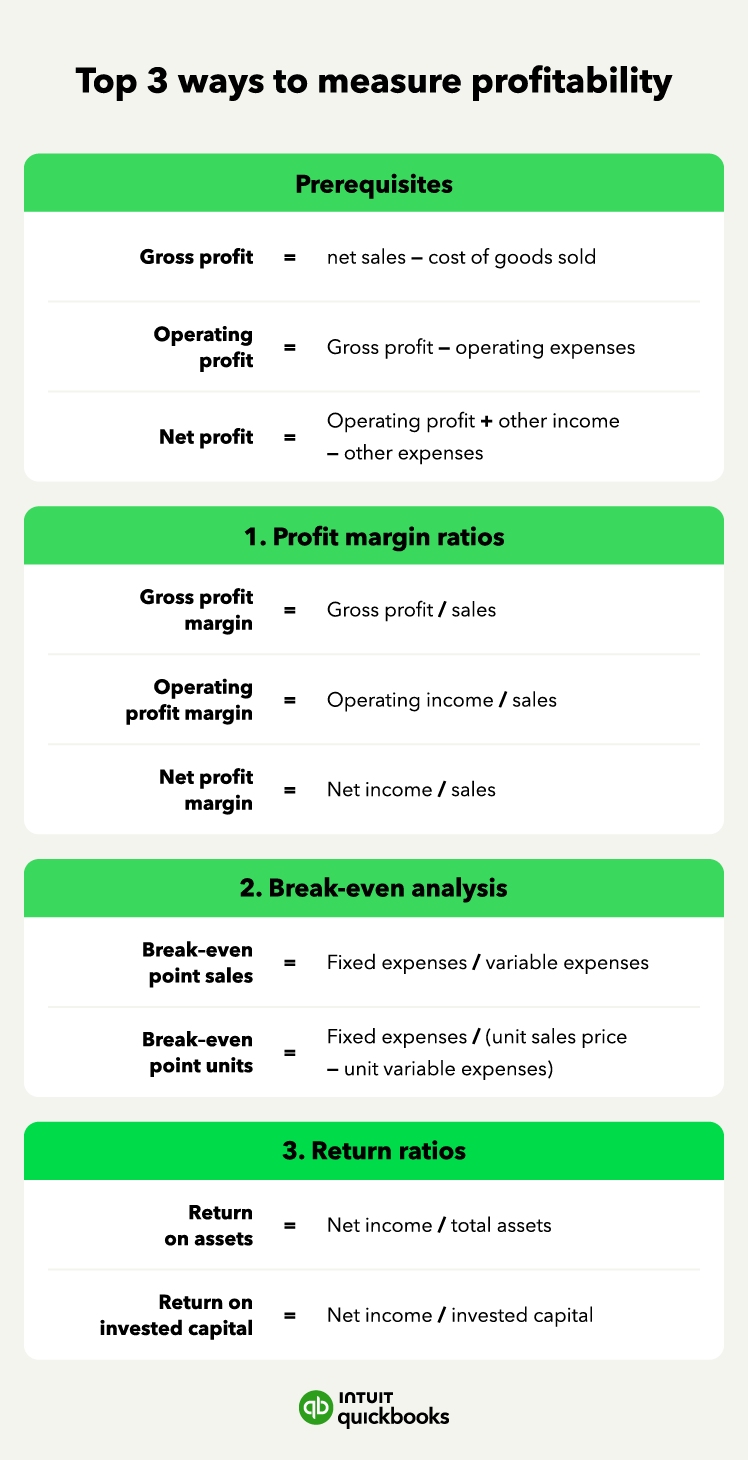
Ratios help you measure efficiency much better than straight dollar amounts. Let’s look at the three key margin ratios:
Gross profit margin
If you sell physical products, gross profit allows you to assess your product profitability. Your total gross profit is sales revenue minus your cost of goods sold. Cost of goods sold represents how much your company paid to sell products during a given period.
Gross profit deducts direct materials, direct labor, inventory, and product overhead. It does not consider your general business expenses. Meanwhile, gross profit margin (aka gross margin) is your gross profit as a percentage of sales. The formula to calculate the gross profit margin ratio is:
Gross profit margin = gross profit / sales
If the gross profit margin is high, you get to keep a lot of profit relative to the cost of your product. One of the primary things you want to concern yourself with is the stability of this ratio.
Your gross margins shouldn’t fluctuate drastically from one period to the other. For example, in your first quarter, you may have a higher gross profit margin than in the fourth quarter, even though your sales were higher. You can then dig into your profit & loss (P&L) statement to determine why. Additionally, ratios allow you to compare your company to others in your industry.
Operating profit margin
Operating profit (aka operating income) is the amount of money you make after considering COGS and operating expenses. Your operating profit margin provides a look at your current earning power.
Unlike gross profit, which you would prefer to be stable, an increase in operating profit margin illustrates a healthy company. The formula for operating margin is:
Operating profit margin = operating profit / sales
The operating margin gives you a good look at how efficient you are. If you’re looking to compare your returns to others in the industry, this is the best ratio to measure the ability to turn sales into pre-tax profits.
One of the things that can keep this ratio stagnant is an increase in operating expenses. If you notice operating costs are creeping up, you may want to dig deeper into your financial statements.
For example, a comparative analysis can help you assess changes in your expenses. This is a side-by-side comparison of numbers from different periods. It’s a little more time-consuming than a basic ratio calculation, but if you can export your data from your accounting software, it gets a bit easier.
Net profit margin
Net profit is the money you make after deducting all expenses. The net profit formula is revenue minus expenses. Net profit margin determines how much of your revenue you’re keeping as net income. The formula to calculate the net profit margin ratio is:
Net profit margin = net income / sales
Note that some industries will have higher profit margins than others. Use industry standards as a benchmark, and perform an internal year-over-year comparison to assess your performance.
2. Break-even analysis
Your break-even point is the point at which expenses and revenues are the same. You’re not making money at your break-even point, but you’re not losing money either. Knowing your break-even point can help with price setting to ensure you’re making a profit.
Break-even analysis will help you plan for the unexpected. Maybe you lose access to raw materials because of a natural disaster, or one of your manufacturers suffers a warehouse fire.wWhatever the case, knowing the break-even point will let you know how much you can afford to lose before you are no longer a profitable business.
You can calculate the break-even point for various components of the business. For instance, you can measure the break-even point as a figure of sales. The formula to do so is:
Break-even point for sales = fixed expenses / variable expenses
You could also measure your break-even point against units sold. The method to do so is:
Break-even point for units sold = fixed expenses / (unit sales price - unit variable expenses)
Running these figures allows you to determine how profitable you’ll remain in the future should something happen to your business.
3. Return ratios
The last two measures of profitability that you can get from your financial statements are return on assets (ROA) and return on invested capital (ROIC).
Return on assets (ROA)
ROA shows total revenue compared to total assets. You can use this figure as a comparison tool from period to period within your company and with other firms in your industry. The higher the ROA, the more efficiently your business is operating. The formula for ROA is:
Return on assets (ROA) = net income / total assets
For example, if your net income is $10,000 and you have $100,000 in total assets. Your ROA is 10%, or $10,000 / $100,000 = 10%.
Return on invested capital (ROIC)
ROIC shows how much you’re earning versus the investments you make. Measuring profitable investments will ensure that you’re putting your money in the right places. The ROIC formula is:
Return on invested capital (ROIC) = net income / invested capital
You can measure ROIC for your entire company or for certain projects. In the case that you’re measuring companywide ROIC, invested capital is your debt plus equity.
From our example above, say you still have $10,000 in net income, but also $25,000 in debt and $25,000 in equity (which you’ll find on your balance sheet). Your invested capital is $50,000, and your ROIC is 20% ($10,000 / $50,000).
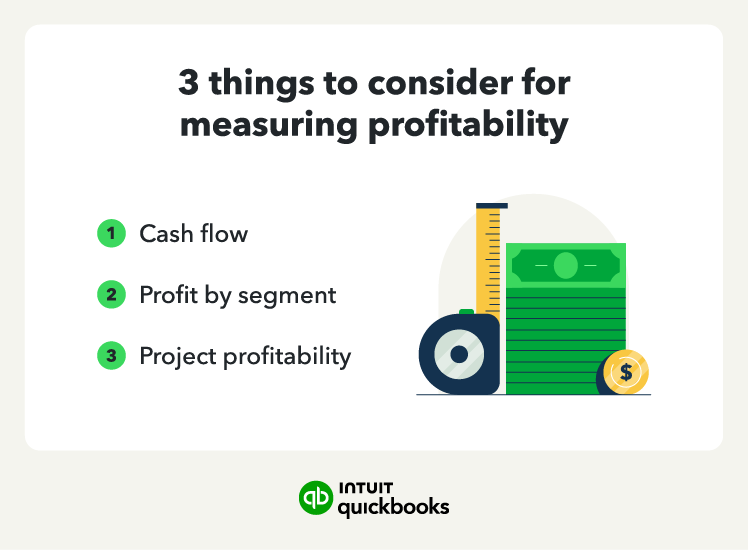
Other ways you’ll want to measure profitability


