








- US small businesses employed 12,929,100 people in Q3-2026.
- Small business employment decreased by 28,700 jobs compared to Q2-2026, a quarterly decline of 0.22% — the third consecutive quarter of decline.
- Jobs decreased in all 12 sectors, with professional and business services seeing the largest decrease.
- Employment decreased in all 8 US regions and in all 20 states tracked, with the Southeast experiencing the largest decrease.
- Average quarterly revenue decreased by $198 (0.13%), a second consecutive quarterly decline.
Get 50% OFF QuickBooks
for 3 months
for 3 months

US small business jobs and revenue both slip in Q3-2026
Q3-2026 small business highlights
Small business employment in the US decreased by 28,700 jobs in Q3-2026, a quarterly decline of 0.22% and the third consecutive quarter of declining employment.
Revenue moved the same direction. Average quarterly revenue decreased by $198 (in 2017 dollars), a 0.13% quarterly decline and the second straight quarter of falling revenue.
How to use this dashboard
Explore the data yourself in the dashboard above. Use the Metric buttons to switch between employment and revenue, then the Chart buttons to view quarterly totals, quarterly growth, or a breakdown by region, state, or sector.
Quarterly trends by sector
All 12 sectors tracked by the Index posted small business employment declines in Q3-2026, with quarterly rates tightly clustered between -0.16% and -0.43%. Professional and business services (NAICS 54-56) had the largest absolute loss, shedding 5,900 jobs. Utilities (NAICS 22) had the fastest rate of decline (-0.43%).
On revenue, nine of 12 sectors declined. Utilities again stood out, posting both the largest dollar drop (-$10,710) and the fastest rate of decline (-3.94%) of any sector. Three sectors grew: agriculture, natural resources and mining (NAICS 11; 21) led, with both the largest gain ($4,400) and fastest growth rate (2.43%).
Worth a closer look
Three sectors — education and health services, financial activities, and natural resources and mining — grew revenue while shedding jobs this quarter. Every other sector moved in the same direction on both fronts. Utilities moved fastest on both fronts: the fastest employment decline and the largest and fastest revenue decline.
Quarterly trends by region
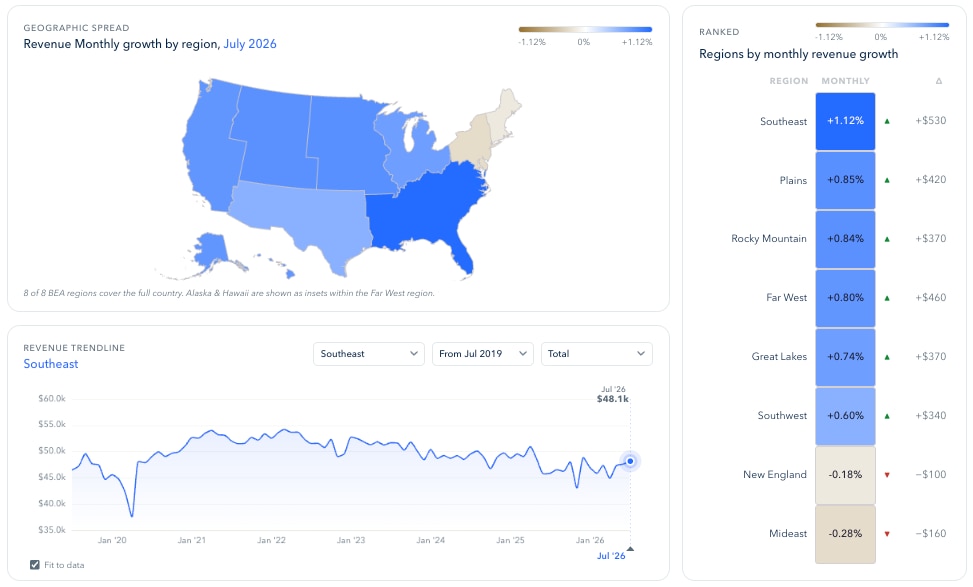
All eight US regions saw employment fall in Q3-2026. The Southeast had the biggest hit, losing 6,600 jobs (-0.21%), while the Rocky Mountain region had the fastest rate of decline (-0.25%).
Revenue fell in five of eight regions. New England had the steepest drop, both in dollars (-$2,500) and rate (-1.56%). Southwest posted the largest gain ($820), while Southeast had the fastest growth rate (0.56%).
Quarterly trends by state
Every one of the 20 states tracked by the Index saw employment decline in Q3-2026. California had the largest drop (-3,000 jobs, -0.20%), while Oregon had the fastest rate of decline (-0.37%, -600 jobs).
On revenue, 13 of 20 states grew. Oregon led the way, posting both the largest gain ($3,990) and the fastest growth rate (3.07%) of any state. The other seven states declined: New York had the largest dollar drop (-$3,520), while Minnesota had the fastest rate of decline (-2.22%).
Indiana is the one consistent bright spot: four straight quarters of revenue growth, the longest active streak.
The bigger picture
Small business employment in every sector and every region tracked by the Index has now declined for three consecutive quarters (Q1-Q3 2026) — a shift from 2025's sharp, uneven swings to a steady, broad-based slide.
Last quarter


Recommended for you



Get the latest data insights in your inbox
Sign up to get the latest insights from the Small Business Index as soon as they are published each month.
Looking for something else?
Call Sales: 1-800-285-4854