QuickBooks Blog
Midsize business

Ending inventory formula: Definition, importance, and key use cases


Key takeaways:

  • Ending inventory refers to the value of goods remaining at the end of an accounting period.
  • The formula to calculate ending inventory is: Beginning Inventory + Purchases – Cost of Goods Sold.
  • Ending inventory helps you track how much inventory you have left, allowing you to manage stock, control costs, and plan ahead.


Rising costs are squeezing small businesses more than ever. According to QuickBooks’ Small Business Insights, inflation has been the No. 1 challenge identified by business owners in every survey wave since April 2023.

In times like these, keeping tighter control over your inventory, a key current asset, can help protect your bottom line. Knowing exactly how much stock you have—and how much you actually need—can help you cut inventory waste, prevent overbuying, and stay profitable.

That’s where the ending inventory formula can help. It’s a simple but powerful way to control spending, avoid overstocking, and keep your business running smoothly. Learn how the formula works, different ways to calculate it, and how to use it to make smarter inventory decisions.

Table of contents: 

What is ending inventory and why does it matter? 

Ending inventory, or closing inventory, is the value of all the products your business still has on hand and ready to sell at the end of an accounting period—whether that’s the end of a month, a quarter, or the year.

Why does ending inventory matter?

Ending inventory gives you a clear picture of what’s left on your shelves or in your stockroom after sales and shows how much value is still tied up in products you haven’t sold yet. It directly affects your profits and the value of your business on financial statements.

That said, inventory isn’t just the purchase price of the items you’re selling. It also includes other costs needed to make those goods ready for sale. That can mean:

  • Shipping costs to get the product to you
  • Preparation or assembly fees
  • Packaging materials
  • Display or shelving costs for in-store presentation

All of these costs count toward the value of your ending inventory.

The ending inventory formula

To manage inventory effectively, you need a reliable way to calculate what’s left at the end of a given period. The ending inventory formula gives you a simple snapshot of your remaining stock so you can make informed purchasing, budgeting, and sales decisions.

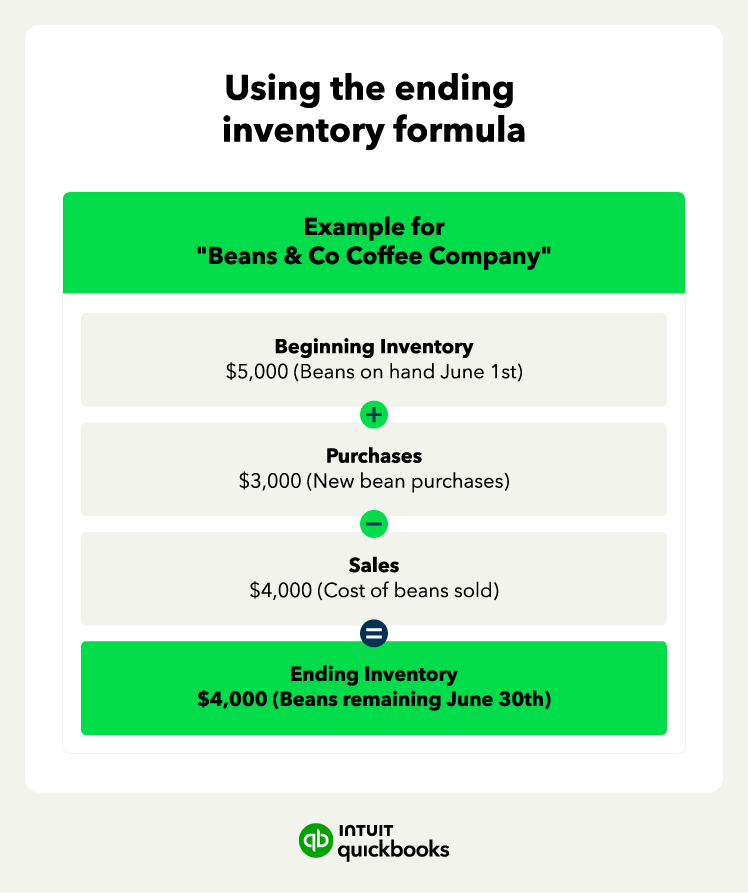
Ending Inventory Formula = Beginning Inventory + Purchases – Sales

An example of the ending inventory formula in action, using a coffee company as an example.

Beginning inventory plus purchases is referred to as the cost of goods available for sale. The goods are either sold or remain in ending inventory. When items are sold, the current cost is moved from inventory into the cost of goods sold (COGS) account.

This formula helps you calculate ending inventory and keep a clear handle on your inventory at all times. It lets you:

  • See how much product you have left by subtracting sales from total stock.
  • Improve inventory control by avoiding overstock or stockouts.
  • Plan future orders based on what’s sold and what’s left.
  • Keep financial records accurate by tracking real inventory value.
  • Control spending by buying only what you need to meet demand.

Inventory purchases increase the balance, while sales decrease the amount of inventory on hand. By changing any of the numbers in the formula, you can test out “what if” scenarios, like how higher sales or larger purchases affect your stock and cash flow.


note icon

Run the ending inventory formula at the end of each month to spot slow-moving items, prevent stockouts, and avoid overbuying. It’s a simple way to improve inventory control without expensive software.


Ending inventory vs. average inventory

Average inventory is the average value of your inventory across an entire accounting period. Here’s how to calculate the average inventory:

Average Inventory Formula: (Beginning Inventory + Ending Inventory) / 2

Ending inventory is a snapshot of what you have at the end of the period, but average inventory gives you a broader view. It smooths out fluctuations so you can better understand how much inventory you typically carry over time. Each one has a different use:

  • Ending inventory is key for accurate balance sheets. It affects your COGS and directly impacts your profits.
  • Average inventory helps measure efficiency. It’s used in formulas like the inventory turnover ratio, which tells you how quickly you’re selling through products.

One more thing: Your ending inventory from one period becomes the beginning inventory for the next. So, when you calculate the average inventory for the next cycle, you’ll use this number again.

How to use the ending inventory formula

To use the formula, first decide how much ending inventory you want to keep at the end of the month. This amount can be based on a percentage of your monthly sales.

Keeping some inventory on hand helps you fill early orders next month without delay. To plan ahead, estimate your monthly sales and plug your numbers into the ending inventory formula:

Ending Inventory = Beginning Inventory + Purchases – Sales

Let’s walk through an example:

  • A sporting goods store starts the month with 7,000 baseball bats in inventory. 
  • They expect to sell 20,000 bats
  • To stay ready for early orders next month, they want to keep 2,000 bats in ending inventory (10% of projected sales). 

Using the formula, they can figure out how many bats to purchase:

20,000 projected sales + 2,000 ending inventory – 7,000 beginning inventory = 15,000 purchased

Our example shows inventory in units, but you’ll also need to calculate the dollar value of each item. There are different ways to do that, such as first in, first out (FIFO), last in, first out (LIFO), or weighted average cost.

5 Ending inventory methods and examples

The ending inventory balance in the balance sheet is the number of units in inventory multiplied by each unit’s cost. Here are five common methods used to calculate inventory valuation:

1. First-in, first-out (FIFO) method

The FIFO method assumes that the oldest items in inventory are sold first.

Let’s assume that a retailer called Seaside Candles sells home furnishings, including several product lines of candles. The current inventory of Seaside Candles includes these purchases:

  • 500 candles purchased on Dec 1st for $10 each
  • 250 candles purchased on Dec 15th for $12 each
  • 750 candles purchased on Dec 20th for $13.50 each

If Seaside sells a total of 400 candles on December 25th, the FIFO method values the candles sold at $10 each. Most companies use the FIFO method to value items sold out of inventory. Some firms, however, use the last-in, first-out (LIFO) method.

2. Last-in, first-out (LIFO) method

To understand the LIFO method, think about buying milk at the grocery store.

The oldest gallons of milk are pushed to the front of the refrigerator so that you’re more likely to buy the older product before it expires. To get to the newer milk, you have to reach behind the old products. Getting to the newer milk is the LIFO method.

LIFO assumes that the newest units are sold first. If Seaside uses the LIFO method, the 400 candles sold on December 25th are valued at $13.50 each.

3. Weighted average cost method

To compute the weighted average cost, you add the total dollar amount of purchases and divide the balance by the total number of units purchased.

Here is the total dollar amount of the three purchases of Seaside Candles:

  • 500 candles at $10 each = $5,000
  • 250 candles at $12 each = $3,000
  • 750 candles at $13.50 each = $10,125

The retailer spent $18,125 to purchase 1,500 candles, and the average cost per candle is $12.08. If the business uses the weighted average cost, $12.08 is assigned as the cost of each candle sold.

4. Gross profit method

The gross profit method estimates ending inventory when a physical count isn’t possible, like during a mid-month report or after a loss, such as fire or theft. It’s quick and helpful for temporary reporting but shouldn’t be used for final financial statements. 

To use this method, you first estimate your COGS using your gross profit margin, then apply the ending inventory formula.

Estimated COGS = Net Sales × (1 – Gross Profit Margin)

Let’s say Seaside Candles had $5,000 as beginning inventory, $20,000 for net sales for the month, $10,000 of purchases, and a 40% gross profit margin. In this case:

  • Estimated COGS = $20,000 × (1 – 0.40) = $12,000
  • Ending Inventory = $5,000 + $10,000 – $12,000 = $3,000

This method is useful for quick decision-making, but since it's based on estimates, it's not suitable for audits or tax filings.

5. Retail method

The retail method is used by many retailers to estimate inventory without doing a physical count. It works best for stores that sell many low-cost items with consistent markups.

This method compares the total value of inventory at retail prices to its value at cost, using the cost-to-retail ratio.

  • Cost-to-Retail Ratio = Cost of Goods Available for Sale / Retail Value of Goods Available
  • Ending Inventory at Retail = Retail Value of Goods Available for Sale – Sales
  • Ending Inventory at Cost = Ending Inventory at Retail × Cost-to-Retail Ratio

Let’s say Seaside Candles had $60,000 inventory at cost, $100,000 Inventory at retail, and $40,000 of sales. Putting these in the formulae:

  • Cost-to-Retail Ratio = $60,000 / $100,000 = 0.6
  • Ending Inventory at Retail = $100,000 – $40,000 = $60,000
  • Ending Inventory at Cost = $60,000 × 0.6 = $36,000

This method saves time and is simple to apply if you have consistent pricing, but it becomes less reliable with varied discounts or changing markups.

Use a solution like Intuit Assist that helps you keep track of your financial metrics and apply your chosen method automatically, so you don’t have to track it by hand.


Introducing Intuit Assist

Your new generative AI-powered financial assistant. Intuit Assist handles administrative items on your to-do list, so you can focus on big picture growth.

The impact of inventory cost method on profit

The inventory cost method you use affects your profit on the income statement.

Let’s say Seaside Candles sells 400 candles at a market price of $20 each on December 25th. Depending on the inventory valuation method, the profit per candle changes:

  • FIFO method profit: $10 per unit ($20 price less $10 cost)
  • LIFO method profit: $6.50 per unit ($20 price less $13.50 cost)
  • Weighted average method profit: $7.92 per unit ($20 price less $12.08 cost)
  • Gross profit method: If the gross profit margin is 40%, the cost is 60% of $20 = $12. So, profit per unit = $8
  • Retail method: With a cost-to-retail ratio of 0.6, the cost per unit is $12 ($20 × 0.6). The profit per unit = $8

Even though the per-unit profit varies, the total profit stays the same in the long run. Here’s why:

Seaside Candles sold 1,500 candles for a total of $30,000 (1,500 × $20).

The total cost of goods sold is $18,125, based on all inventory purchases.

So, the total profit is still $11,875, no matter which method you use. What changes is when the profit is recognized. 

How inventory methods affect profit timing

Here’s how the timing works:

No matter which method you choose, accounting principles require that you stick with it consistently. This keeps your reports reliable and easy to compare from year to year.

Key advantages of using the ending inventory formula

Using the ending inventory formula helps you understand your stock levels, plan better, and make smarter business decisions.

One big advantage is the ability to test different scenarios. For example, if you think sales might go up next month, you can change that number in the formula and instantly see how much more inventory you'll need. This helps you stay ahead and avoid stockouts or overspending. Below are some other major benefits.

Performing inventory analysis

You can use the ending inventory balances in past months to perform an inventory analysis and to compare your results to other businesses in your industry.

One helpful metric is the inventory turnover ratio: 

Inventory Turnover = Cost of Goods Sold ÷ Average Inventory

A higher turnover ratio means you’re selling products faster without holding too much inventory. That’s a sign of efficient operations.

An image showing the three major inventory tracking and calculation concepts discussed, with an example for each.

Supporting more accurate physical counts

Tracking your ending inventory also helps with physical inventory counts, especially at year-end. If you’ve kept records throughout the year, you’ll know what to expect, so there are fewer surprises during an audit or CPA review.

Here’s how you prepare for accurate inventory counts:

  • Inventory listing: The accountant prints a full inventory report for 12/31 and gives copies to each counter.
  • Restricted access: No inventory is moved in or out of storage on the day of the count.
  • Numbered tags: Each item is tagged with cost, description, and quantity.
  • Matching: Counters match tags to the printed report, note any differences, and tag numbers.
  • Reviewing differences: The accounting team checks any mismatches and adjusts records if needed.

When you keep a close eye on your ending inventory, it’s easier to explain changes. For example, if you bought heavily before the holidays but sold most of it in December, your 12/31 inventory will naturally be lower.

Common challenges with the ending inventory formula 

The ending inventory formula is a helpful tool, but it’s not perfect. It gives you an estimate, not a guarantee. Many real-world factors affect inventory sales and purchases, which can throw off your assumptions.

Here are three common challenges that impact how well the formula works—and what you can do to address them:

Vendor issues

Sometimes vendors can’t deliver what you ordered. If a supplier runs low on raw materials, production processes may slow down, and your order could arrive late or incomplete.

Example: You place an order for 1,000 holiday-themed candles in early November. The vendor faces a wax shortage and only sends 600 units. This leaves you short just as seasonal demand spikes.

How to handle it:

  • Diversify your suppliers so you’re not relying on just one.
  • Build safety stock to cover delays.
  • Improve communication with vendors about lead times.
  • Review vendor performance regularly to spot issues early.

Changes in demand

Customer tastes shift quickly, and economic conditions can also affect what people buy. That makes it harder to predict sales accurately.

Example: You plan to sell 500 high-end diffusers this month. But a competing store drops their price, and your sales drop to 250.

How to handle it:

  • Use demand forecasting tools that include trends and seasonality.
  • Stay flexible with agile inventory strategies.
  • Analyze sales data weekly or monthly to adjust in real time.
  • Apply ABC analysis to focus on your most important products.

note icon

To improve your ending inventory accuracy, update your sales and purchase assumptions regularly, and revisit your ABC analysis quarterly. This ensures your formula reflects what’s really happening in your b


usiness.

Product mix changes

You might need to adjust your inventory strategy if certain products aren’t selling well or if you shift focus to higher-profit items.

Example: You drop the price on entry-level oil warmers to stay competitive, but now they bring in less profit. You decide to stock fewer of them and invest more in a new premium line.

How to handle it:

  • Run product performance reviews often to track sales and margins.
  • Keep cross-team communication open between sales, marketing, and inventory.
  • Set up flexible purchasing agreements so you can pivot when needed.
  • Track your available-to-promise (ATP) inventory to manage what’s really sellable.

When should you use the ending inventory formula? 

If your business carries inventory, the ending inventory formula is a must-use tool. It helps you track inventory value, stay financially accurate, and make better business decisions. Use the formula when you need to:

  • Prepare financial statements like balance sheets or income statements.
  • Calculate the cost of goods sold and determine your true profit
  • Control inventory costs by preventing overstocking or underordering.
  • Forecast inventory needs and set smarter purchasing budgets.
  • Comply with tax rules that require accurate inventory reporting.
  • Analyze performance and monitor trends across months or quarters.
  • Balance stock and cash flow so you don’t tie up too much money in unsold goods.

The ultimate goal is to have just enough inventory to meet demand without overspending, so your business stays profitable and runs smoothly.

Take control of your inventory strategy with QuickBooks

Managing ending inventory isn’t more than counting what’s left. It’s also about understanding how different inventory types affect your cash flow, profit, and ability to meet demand. Whether you run a retail store, manufacturing unit, or e-commerce business, using the ending inventory formula gives you the insight needed to make smarter decisions.

Tools like QuickBooks can help you go even further. With built-in features for inventory tracking, job costing, and reporting, QuickBooks makes it easier to monitor what you have, what you need, and how it all fits into your bigger financial picture.

Try QuickBooks today and simplify the way you track, plan, and grow.


Recommended for you

Mail icon
Get the latest to your inbox
No Thanks

Get the latest to your inbox

Relevant resources to help start, run, and grow your business.

By clicking “Submit,” you agree to permit Intuit to contact you regarding QuickBooks and have read and acknowledge our Privacy Statement.

Thanks for subscribing.

Fresh business resources are headed your way!

Looking for something else?

QuickBooks

From big jobs to small tasks, we've got your business covered.

Firm of the Future

Topical articles and news from top pros and Intuit product experts.

QuickBooks Support

Get help with QuickBooks. Find articles, video tutorials, and more.