You could save up to 25% on transaction costs².
Speak with us now to see if you qualify.
Talk to sales 1-800-515-8366
Monday - Friday, 6 AM to 4 PM PT

Table of contents
Table of contents
Key takeaways:
How much is the inventory on your shelves impacting your working capital? Calculating your days inventory outstanding (DIO) can help you answer this question. According to the Entrepreneurship in 2026 survey, more than half of aspiring entrepreneurs lack confidence in the basics like cash flow, invoicing, and expense tracking. The more information you have about your business, like DIO, the better you can plan for the future.
To help you gain insight into your business's financial health, we’ll look at what days inventory outstanding means, how to calculate it, and what steps you can take today to improve your DIO.
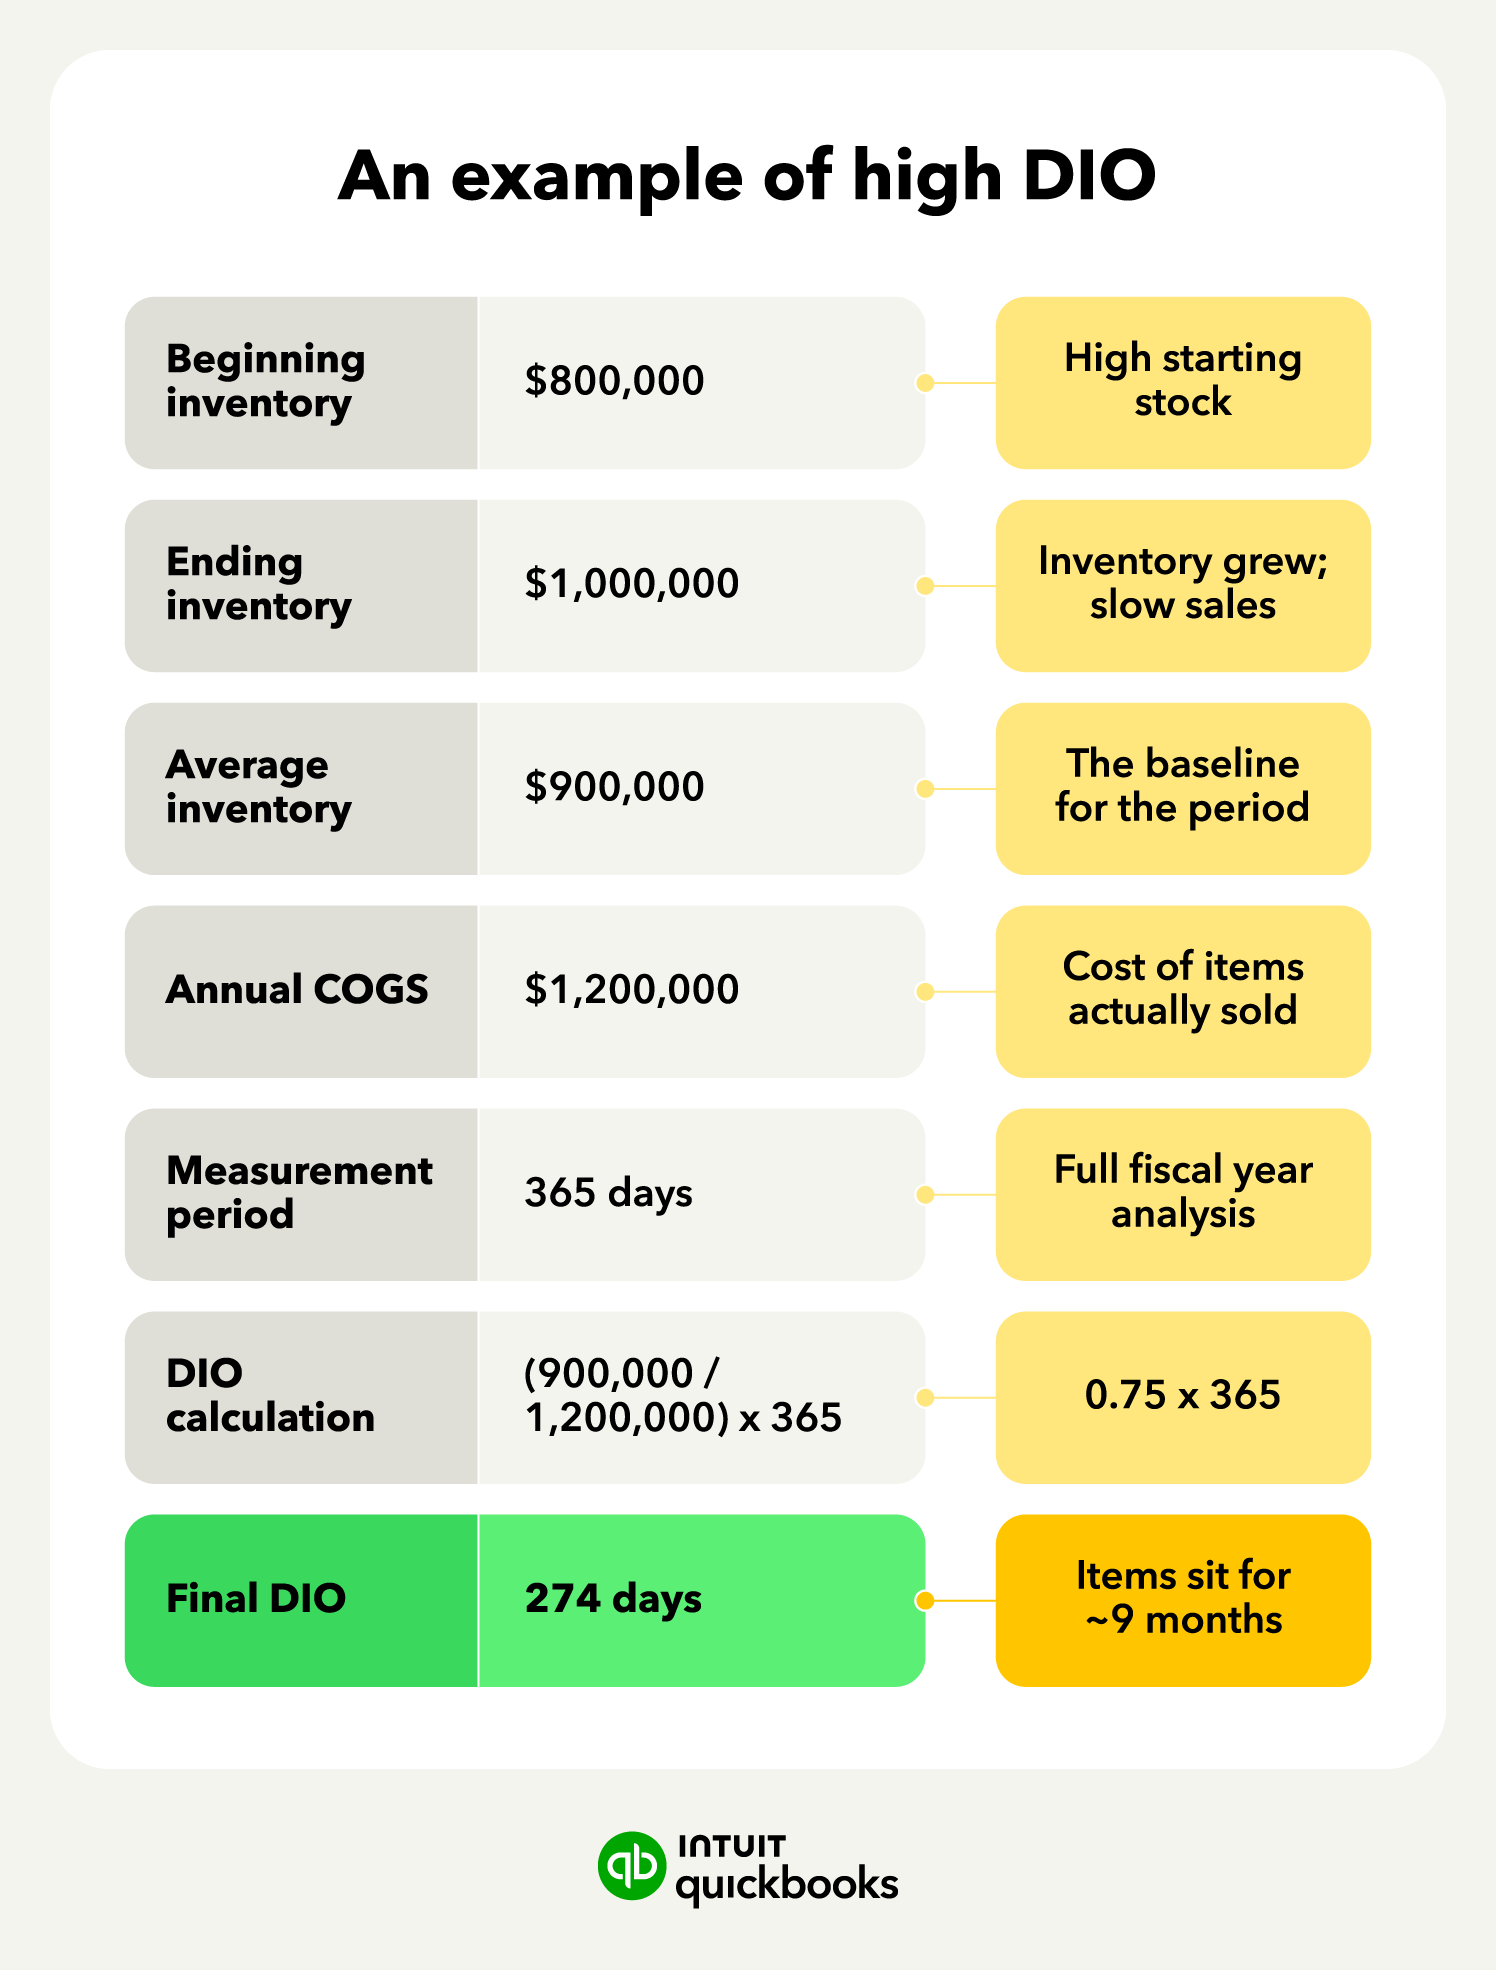
Days inventory outstanding (DIO) is a metric that looks at how many days, on average, your stock sits on the shelf before selling. Also referred to as days of inventory on hand (DIH), using the DIO formula can help you calculate just how long your capital remains tied up in inventory.
A high DIO creates trapped capital, meaning the money you’ve spent on the inventory is just sitting there, unable to be converted to revenue.
Seasonal businesses, large corporations, and manufacturers are just a few examples of successful companies that often operate with a high DIO. Conversely, while a low DIO suggests a lean operation, going too low can trigger its own problems. This is why you need to look at the full inventory picture using real-time data so that you can react quickly to market and supply chain changes.
To help you gain insight into your cash flow, we’ll look at how you can calculate your days inventory outstanding and what the results mean for your business.
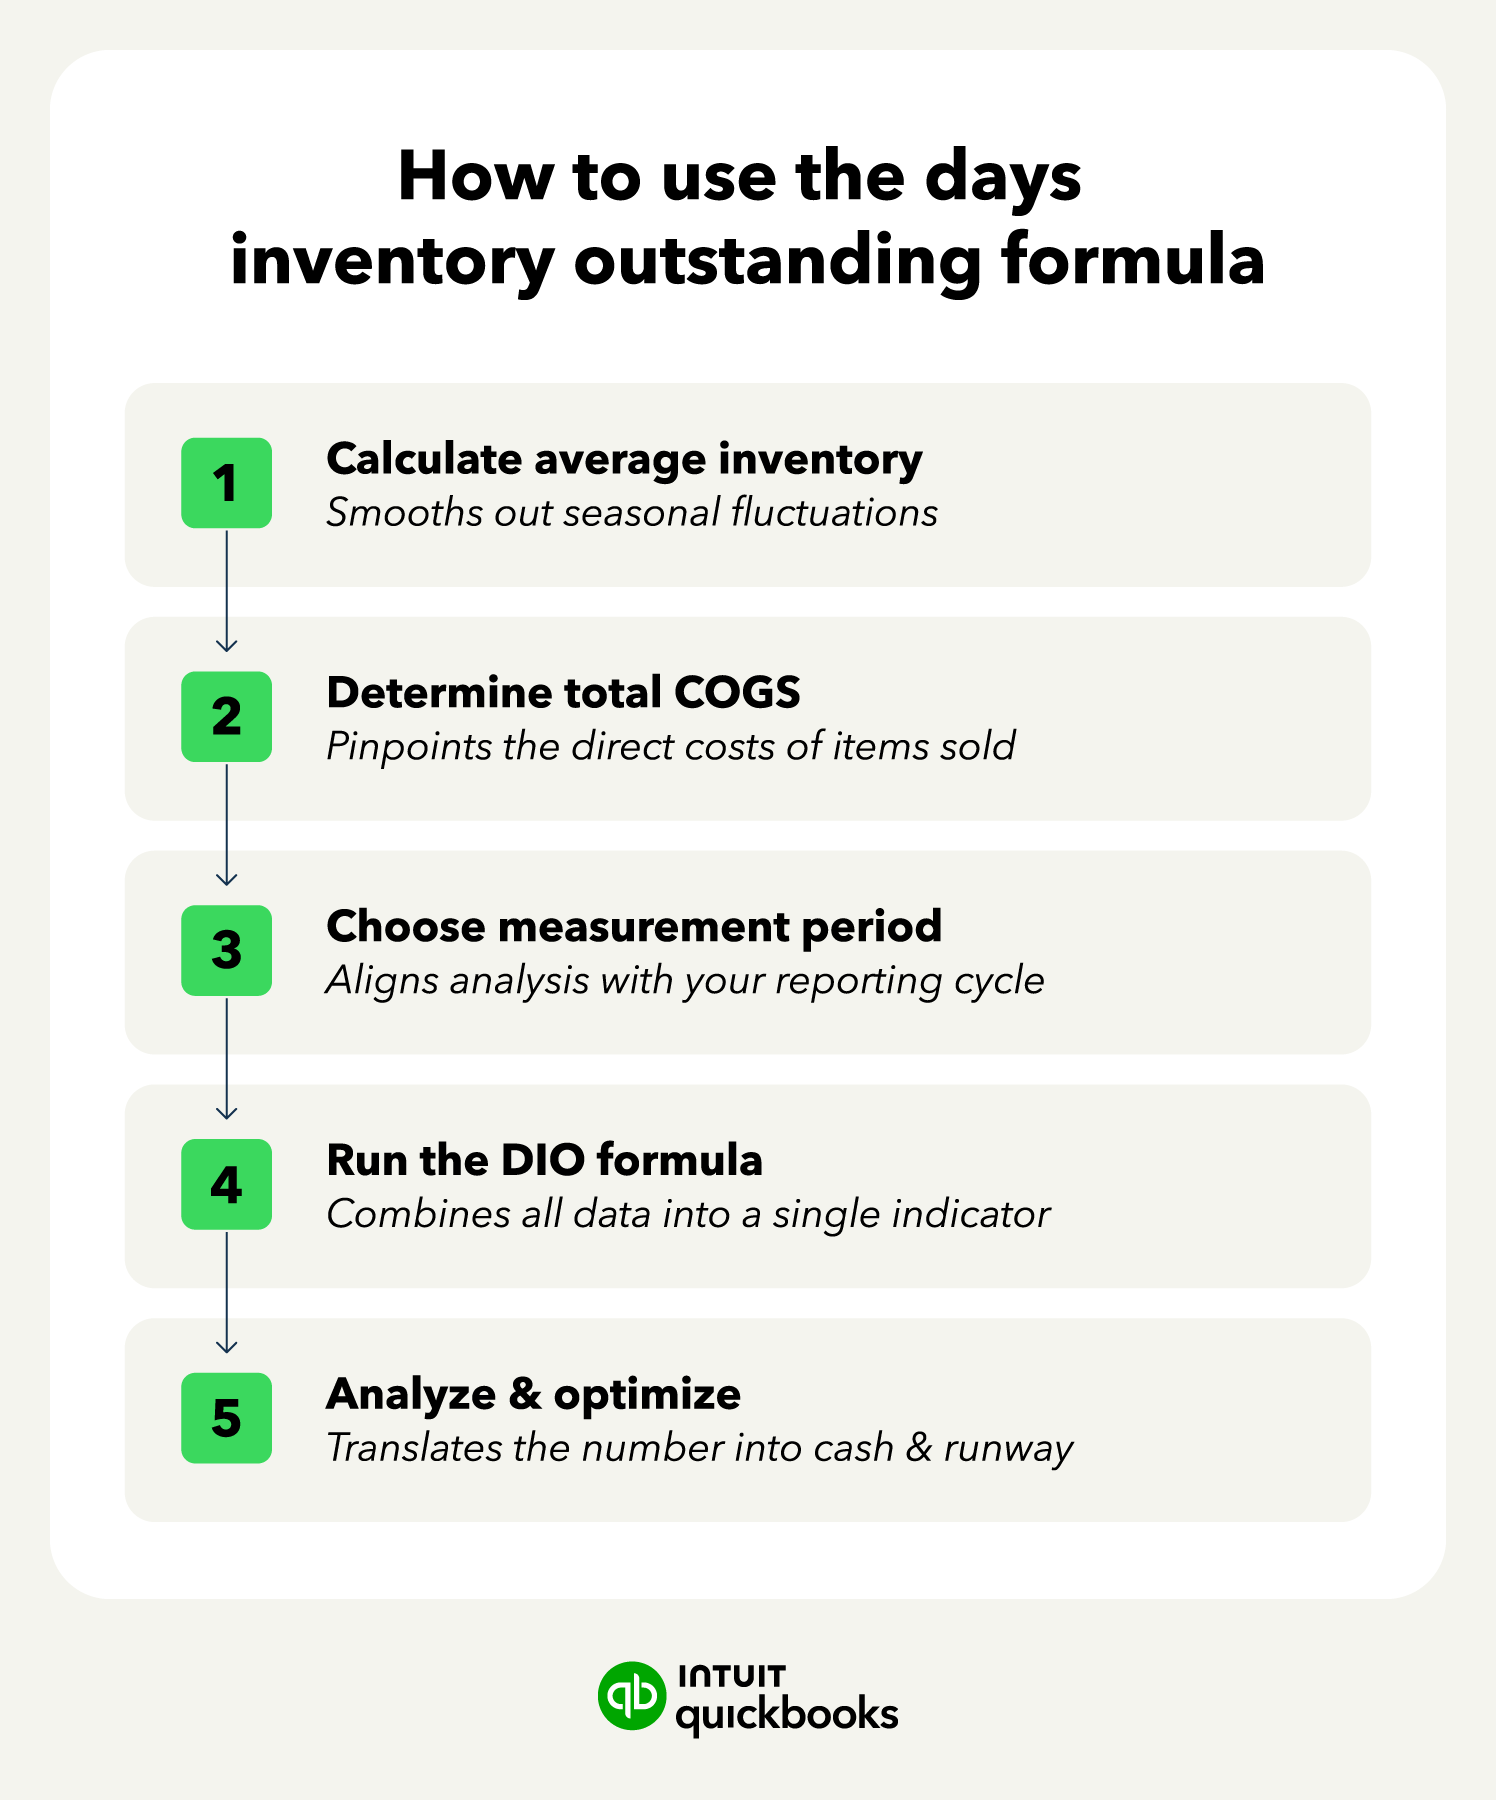
When it comes to calculating your DIO, the key components of the formula are:
Below, we’ll walk through the five steps in this process, explaining how each of these numbers is used in calculating your DIO.
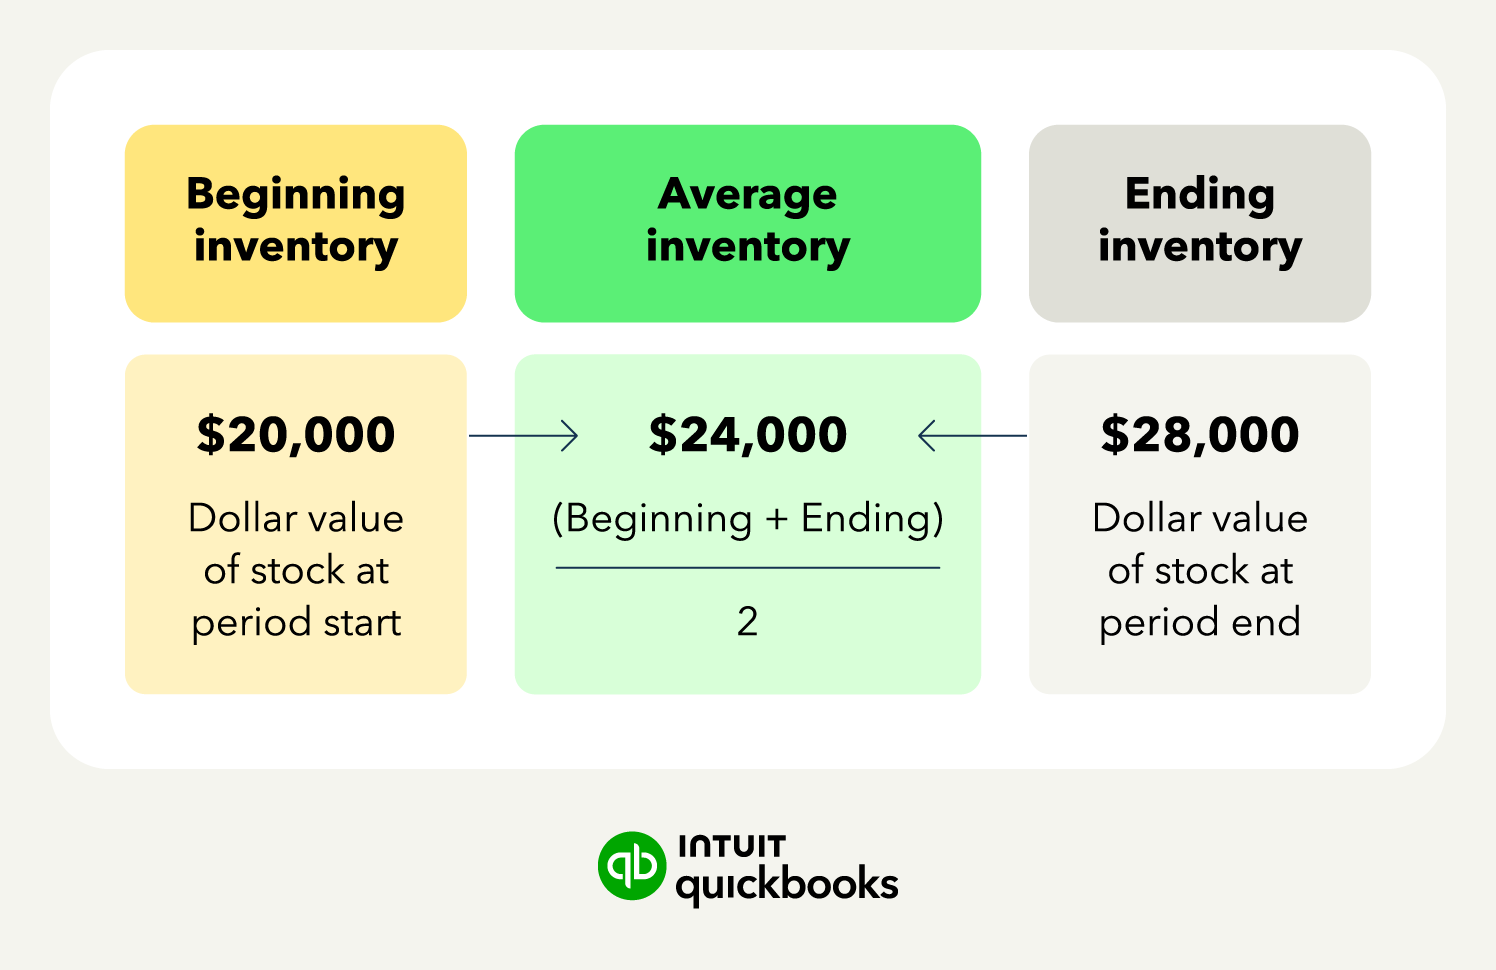
The first part of the DIO formula involves calculating your average inventory level. Changes in season, demand, market, and more can cause your inventory levels to fluctuate quite a bit from week to week and month to month. To get a stable number, you should add your dollars in inventory at the beginning of the period to the dollars at the end of the period, then divide by 2.
Average Inventory: (Begining Inventory $ + Ending Inventory $)/2
For example, if you had $20,000 in inventory at the beginning of the month and $28,000 at the end, then the calculator would be: ($20,000 + $28,000)/2. This would equal $24,000.
Not only does averaging like this help avoid skewed numbers caused by seasonal or market shifts, but the average inventory formula also smooths out huge inventory jumps due to large sales events or massive restocks.
Next, you need to determine the cost of the goods you have already sold. This includes the cost to acquire your inventory, the purchase of raw material, and the costs associated with getting your products ready to sell (i.e., labor costs).
However, it should not include expenses like property/vehicle rent, advertising, or the cost of shipping goods to customers. The reason this COGS metric is used in the DIO calculation is that it reflects the actual movement of goods out of your warehouse.
To ensure you are using up-to-date, accurate numbers, check your profit and loss (P&L) statements.
The third component of the DIO calculation is the measurement period. This will be the same time span you used earlier for the average inventory and COGS calculations.
Monthly tracking (30 days) offers a great starting point for tracking your DIO in as close to real-time as possible, helping you pivot faster as supply and demand shift. Quarterly tracking (90 days) can give you a more stable view of DIO, smoothing out any short-lived sales slumps or spikes.
For a year-end evaluation, calculating DIO with 365 days can give you the insight you need on your business's overall inventory efficiency.
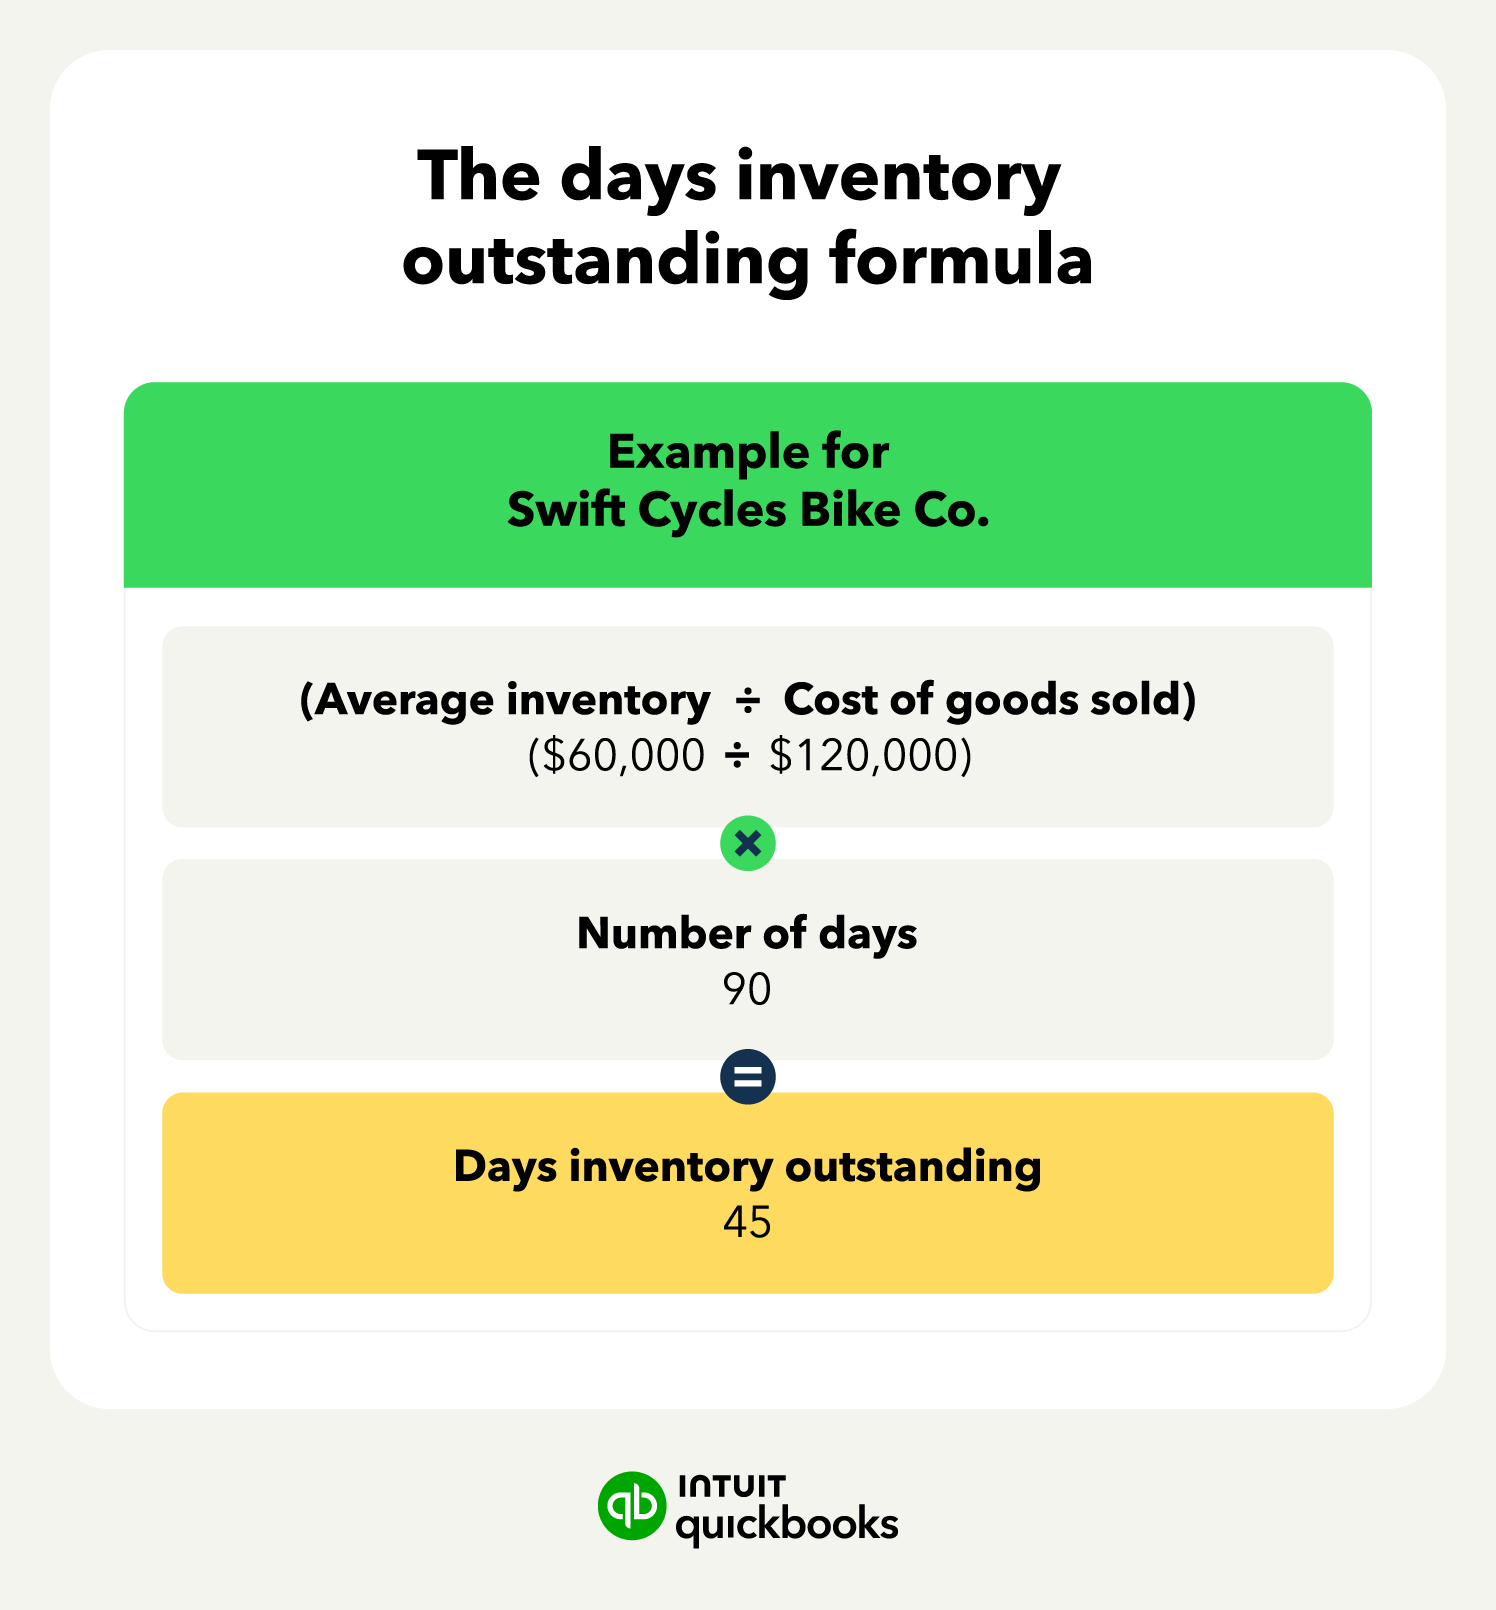
Now that you have all of the numbers that you need, it's time to use them to calculate your DIO. As a reminder, the formula is (average inventory/COGS) * time period.
Days inventory outstanding: (Average Inventory/COGS)*Time Period
As an example, let’s say Business A is a fitness company wanting to evaluate its DIO for the first quarter. For those 90 days, their average inventory dollar amount was $20,000 while COGS was $100,000. This $20,000 divided by $100,000 equals 0.2. If we multiply this number by 90 days, the result is 18. This means their DIO is 18 days.
As an alternative, if you want to evaluate a shorter period of time, like a month, using ending inventory instead of average inventory offers a quick, real-time view of DIO.
Short Time Period DIO: (Ending inventory/COGS)*Time Period
While an option, the snapshot method introduces significant volatility. Because it relies on a single point in time, it strips out daily operational fluctuations. A massive inventory restock on Day 29, or an aggressive end-of-month promotional clearance, will heavily skew your ending inventory balance, yielding an artificially inflated or deflated DIO that misrepresents your true baseline working capital velocity.
If you want to focus more on revenue, switch COGS to total revenue for the period.
Revenue-Focused DIO: (Average Inventory/Total Revenue)*Time Period
The turnover method is another option, which offers a shortcut to the DIO traditional formula. This takes your COGS and divides it by your average inventory over a set period to determine your inventory ratio.
You can then use the number of days in the period and divide it by the ratio to get your DIO. This DIO method can be especially useful if your accounting/inventory system calculates the ratio for you.
Inventory Ratio DIO: Time Period/(COGS/Average Inventory)

Calculating your DIO gives you a number, but you still have to look at the whole picture to make sense of it. In our Business A example, the DIO is 18 days. This means that, for this company, products sit on the shelf for an average of 18 days before they are sold. Is this a good number or not? Well, the answer depends on several other factors.
Let’s say the company has net 10 terms with its supplier. If they have to pay their suppliers in full within 10 days but the product takes 18 days to sell, they have an 8-day cash gap to cover. On the other hand, if the lead time from suppliers is 3 weeks, then the company could find itself in a stockout situation as its DIO is shorter than the lead time.
Analyzing your DIO results like this is important to ensure you understand what the number means and how it impacts your business.
While there is no true universal “good” DIO value, there are certain average expectations. Below is a breakdown of the expected DIO range in each industry.
These ranges are just loose suggestions. Your industry, structure, vendor relationships, customer base, products, season, and more all have an influence on determining what DIO number you should aim for.
For instance, you would expect a high-value item like a car to naturally sit in inventory longer than something like a loaf of bread. Or seasonal items like snow shovels to have short DIOs in winter and much longer ones in summer.
To ensure the financial health and performance of your business, you’ll want to keep your DIO low enough to be efficient, but not so low that you risk stockouts, which can frustrate customers and drive them to the competition.
Your DIO is just one piece of the liquidity puzzle. With the cash conversion cycle (CCC), you can measure your business’s true operational efficiency. There are three key components to the CCC calculation:
With these numbers in hand, the calculation is as follows:
Cash Conversion Cycle: CCC = (DIO + DSO) - DPO
If your result is negative, your cash flow posture is in an exceptional position. This means you generate liquid cash from selling inventory (DIO) and collecting customer payments (DSO) faster than your payment obligations to suppliers become due (DPO).
However, if your CCC number is high or trending upward into positive territory, your working capital is trapped in operations, typically signaling one of three structural problems:
Using your DIO and other metrics to measure your CCC can help you quickly spot potential bottlenecks in your operations and make adjustments to optimize your working capital.
 To calculate your CCC using QuickBooks, you’ll want to pull the following reports: profit and loss, inventory valuation summary, accounts receivable aging summary, and accounts payable aging summary. These reports will give you all the numbers you need to make the calculations necessary for determining your CCC.
Having a high DIO is not always a problem, but it can indicate underlying issues with how you manage your inventory levels. You may be ordering too much stock, seeing a sales slump, or not shipping orders fast enough.
To find and fix the problem, there are three main strategies:
1. Perform an ABC analysis: This categorization technique helps you identify high-value products, so that you can more closely monitor the movement of these items, which are likely driving up your DIO.
2. Optimize reorder points: Review your historical sales data and demand forecasts to identify materials you are purchasing in excess. For example, if Widget A only sells 20 a month but you are ordering 40 a month, lowering your order point can reduce your safety stock and overall DIO.
3. Audit supplier lead times: How long does it take you from placing an order to actually receiving the material from the supplier? If the lead time is low, you can potentially decrease your order point. However, if the lead time is 30 days or more, you may need to hold more inventory to bridge the gap.
Using bookkeeping and accounting software like QuickBooks can help you quickly view all the numbers, run forecasts, and offer you insight into addressing your high DIO.
Knowing your DIO can give you key insight into how your business is operating, but it is just one piece of the puzzle. With QuickBooks Online, you can keep an eye on all aspects of your business, from managing your inventory and sending out invoices to evaluating cash flow and forecasting.
Gain access to real-time data with QuickBooks Online to seize opportunities and navigate business challenges as they arise.

Call Sales: 1-800-285-4854