


As we discussed in our recent blog on demand forecasting and the supply chain, effective supply chain management is becoming increasingly complex as a result of key market forces such as growing demand volatility and globalization.
Get 50% OFF QuickBooks
for 3 months
for 3 months

inventory
Smarter demand forecasting using smoothed moving average
Smoothed moving average is a demand forecasting model that helps combat the effects of these market forces to reveal prevailing trends over a period of time.
Let’s take a closer look at how it works.
What is smoothed moving average?
Smoothed moving average (SMMA) is a demand forecasting model that can be used to gauge trends based on a series of averages from consecutive periods.
For example, the smoothed moving average from six months of sales could be calculated by taking the average of sales from January to June, then the average of sales between February to July, then March to August, and so on.
This model is called ‘moving’ because averages are continually recalculated as more data becomes available.

What are the pros and cons of the smoothed moving average model?
Smoothed moving average is useful for looking at overall sales trends over time and aiding long-term demand planning. Rapid changes as a result of seasonality or other fluctuations are smoothed out so you can analyze the bigger picture more accurately. The smoothed moving average model typically works well when you have a product that’s growing consistently or declining over time.
By definition, this model ‘smooths out’ sales over a period of time, which means it doesn’t take into account factors like seasonality or rapid changes in sales.
For example, if you triple your sales over Christmas, your smoothed moving average won’t indicate that you need to order more stock during that period. Instead, it will show your average performance over time, such as the whole quarter or year. For this reason, it’s best for examining trends over a long period rather than to forecast for seasonal sales periods.
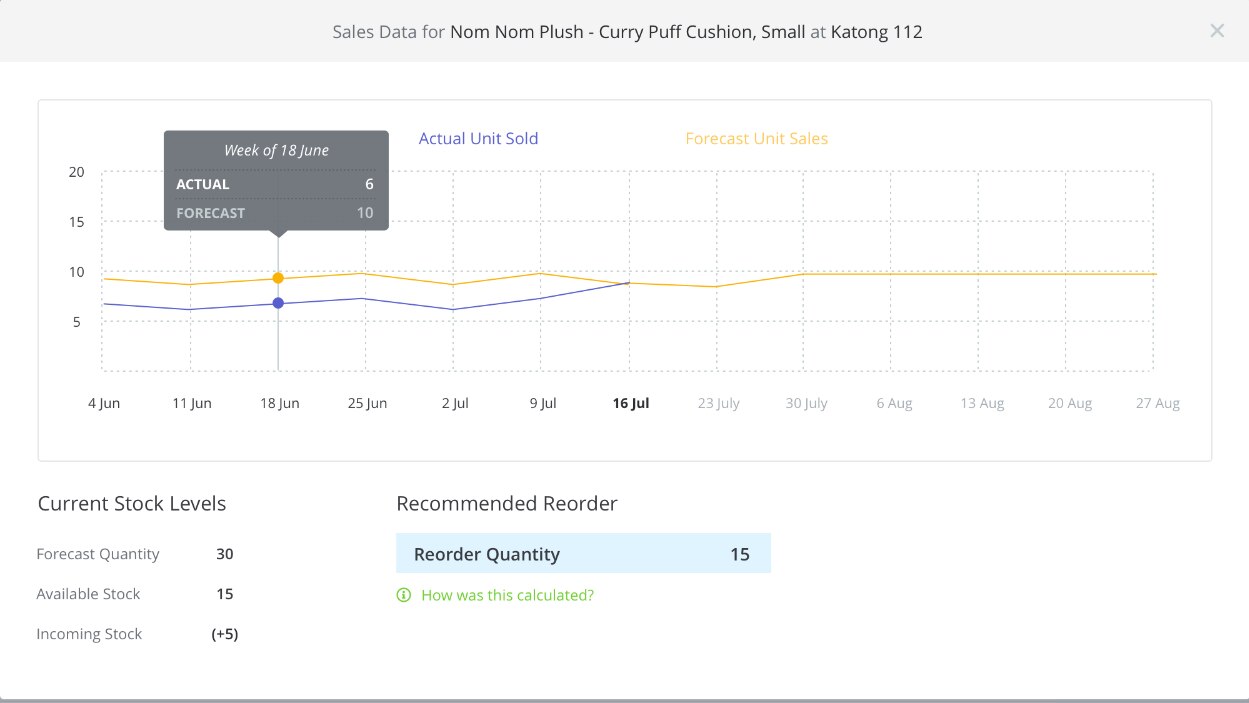
How does the TradeGecko smoothed moving average model work?
TradeGecko’s demand forecasting model uses the smoothed moving average by looking back at a period of two years, and forecasting from the first day of sales within that two-year window. In other words, it forecasts from your first day of sales recorded in TradeGecko up to two years in the past.
You can choose to view predictions based on your average sales by week or month. For example, if you sell 35 units over the course of the first week in February and choose to calculate averages weekly, TradeGecko will predict that you will sell five units every day of the second week in February, i.e. 35 / 7 = 5. If you choose to calculate averages monthly and sell 112 units over the whole month of February, TradeGecko will predict that you will sell four units every day in March, i.e. 112 / 28 = 4.
Any product with no sales data over the past two years will not be included in the forecast.
Want to learn more? Take a look at our detailed overview of the smoothed moving average with TradeGecko.
Related Articles


Get the latest to your inbox
No ThanksLooking for something else?
Call Sales: 1-800-285-4854