Get 50% OFF QuickBooks
for 3 months
for 3 months










Intuit QuickBooks Small Business Index, September 2026
Employment Index
September 2026 jobs report highlights:
- US small businesses employed 12,934,800 people in August 2026.
- Small business employment decreased by 11,100 jobs compared to July, a monthly decline rate of 0.09%.
- Jobs decreased in 11 of 12 sectors, with construction and retail trade tied for the fastest decline rate.
- Small business employment decreased in all 8 US regions, with the New England region experiencing the fastest decline rate.
- Jobs decreased in all 20 states tracked. Indiana had the fastest decline rate.
In August 2026, employment for US small businesses with one to nine employees decreased by 11,100 jobs compared to July (a monthly decline of 0.09%). These businesses now employ 12,934,800 people, based on the Index's projection from the latest available official statistics prior to publication.⁺
Employment by sector:
Small business employment decreased in 11 of 12 sectors tracked by the Small Business Index. The largest decrease (-2,300 jobs) was in the retail trade sector (NAICS 44-45). Construction (NAICS 23) and retail trade (NAICS 44-45) were tied for the fastest decline rate, both falling 0.15%. Agriculture, natural resources, and mining (NAICS 11; 21) was the only sector that didn't decline, holding at 0.00%.
Regional employment trends:
Small business employment also decreased in all eight regions of the US. The New England region (Connecticut, Maine, Massachusetts, New Hampshire, Rhode Island, Vermont) had the fastest decline (-0.16%). The Southeast (Alabama, Arkansas, Florida, Georgia, Kentucky, Louisiana, Mississippi, North Carolina, South Carolina, Tennessee, Virginia, West Virginia) had the largest decrease (-2,500 jobs).
State-level employment changes:
Likewise, small business employment decreased in all 20 states included in the Small Business Index. Indiana had the fastest decline rate (-0.21%), while New York had the largest decrease (-1,300 jobs).
Explore the data using the buttons and charts below

Revenue Index
September 2026 revenue report highlights:
- Average real monthly revenue for US small businesses in August 2026 was $49,850 per business—a decrease of 1.52% compared to July.
- Small business revenue decreased in 9 of 12 sectors, with utilities seeing the fastest decline.
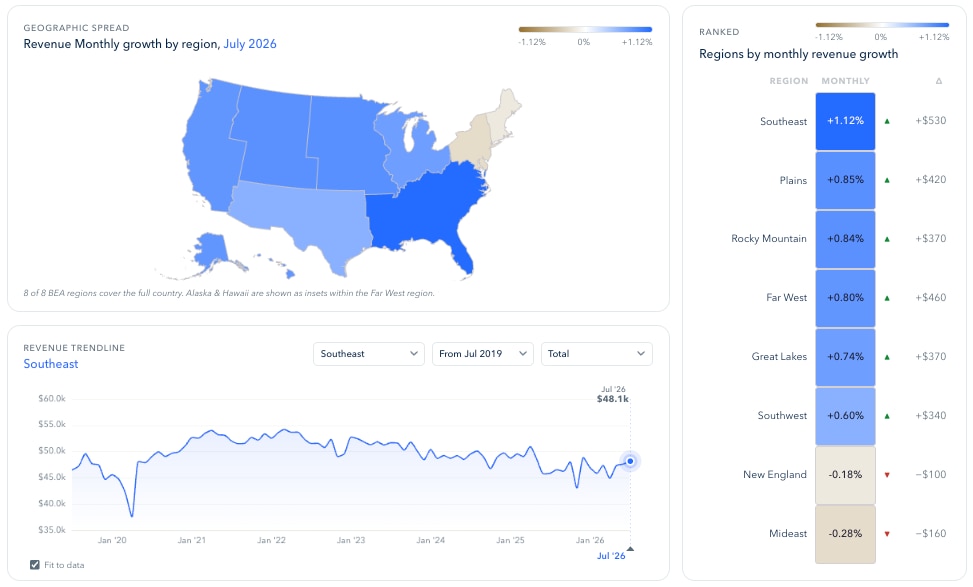
- Small business revenue decreased in all 8 US regions, with the Plains region experiencing the fastest decline.
- Small business revenue decreased in 18 of 20 states. Minnesota had the fastest decline.
In August 2026, the latest estimates from the Small Business Index show average real monthly revenue for US small businesses with one to nine employees was $49,850 per business (in 2017 dollars), a monthly decrease of 1.52%.
The Index is deflated to 2017 dollars to remove the impact of inflation and track real changes in revenue. It is also seasonally adjusted.
Revenue by sector:
Small business revenue decreased in 9 of 12 sectors tracked by the Index. Utilities (NAICS 22) had both the fastest and largest decline, falling 15.00% (-$13,580 per business). At the other end, agriculture, natural resources, and mining (NAICS 11; 21) had both the fastest and largest increase, growing 0.47% ($280 per business).
Regional revenue trends:
Small business revenue decreased in all eight US regions in August. The Plains (Iowa, Kansas, Minnesota, Missouri, Nebraska, North Dakota, South Dakota) had the fastest decline (-2.35%). The Far West (Alaska, California, Hawaii, Nevada, Oregon, Washington) had the largest decrease (-$1,250 per business).
State-level revenue changes:
Small business revenue declined in 18 of 20 states tracked by the Index, while two states grew. Minnesota had both the fastest decline (-4.15%) and the largest decrease (-$2,120). North Carolina and Oregon were the two states that grew, both increasing $80 per business; Oregon edged out the faster rate (0.19% vs. 0.18%).
Explore the data using the buttons and charts below

More information
Get more data insights from the interactive Intuit QuickBooks Small Business Index dashboard.
Media inquiries
Media contact details for QuickBooks in the US can be found here on the Intuit website.
Canada Index
The Intuit QuickBooks Small Business Index is also published monthly in Canada. Get the latest small business employment insights for Canada here.
UK Index
The Intuit QuickBooks Small Business Index is also published monthly in the UK, typically one week later than in the US and Canada. Get the latest small business employment insights for the UK here.
About the Index
The Intuit QuickBooks Small Business Index tracks monthly changes in small business employment and revenue, published in the US, Canada, and the UK. The Index is powered by anonymized data from 533,000 QuickBooks customers, official statistics, and robust economic models developed by Professor Ufuk Akcigit and an international team of independent economists. The economic models normalize anonymized QuickBooks customer data to reflect the general population of small businesses in each country; it is not a reflection of Intuit’s business.

Methodology
The Intuit QuickBooks Small Business Index creates aggregated data outputs from a sample of anonymized QuickBooks Online Payroll customer records which are calibrated using statistical methods to create modeled results which better reflect the general population of small businesses in each country, as represented by published official statistics. Statistical adjustment ensures the Index truly reflects employment and job vacancy changes rather than trends in the QuickBooks customer base.
Read more or download the full methodology here.
Rounded values
Total and monthly changes in employment and job vacancies have been rounded to the nearest hundred. Monthly changes and growth rates are calculated before total employment or job vacancy values are rounded. Rates have been rounded to the nearest hundredth.
Seasonal adjustments
The Index’s data insights are seasonally adjusted to limit the effect of seasonal patterns in employment and hiring throughout the year, which lead to regular fluctuations in workforce growth and contraction.
Employment growth formula
Employment growth(t) = [Employment(t)-Employment(t-1)]/[0.5*Employment(t)+0.5*Employment(t-1)]
*Employment levels
The Index produces a monthly prediction of employment growth rates by country, region, and sector. In order to translate these growth rates into the number of jobs/vacancies gained or lost, the growth rates are multiplied by the prior month’s predicted employment levels, except during the months when official statistics are published. During those months, the latest official employment levels that have been reported are used in the calculation instead of the Index’s prior month’s predicted employment levels. As a result, the Index’s predicted total employment levels may at times differ from the predicted growth rates. Official statistics are published at different frequencies depending on the country ranging from monthly to quarterly.
⁺Note: The Index’s economic model is refreshed every 2 to 4 months when the U.S. Bureau of Labor Statistics updates its employment statistics. Official statistics are an essential component of the Index because they make it nationally representative of small business employment. Whenever they are updated, this provides new information that wasn’t previously available, which is why the Index’s latest estimates for small business employment sometimes differ from older estimates. The latest estimates always provide the most accurate picture of small business employment or hiring because they include the most up-to-date official statistics.
June 2025 methodology update
In June 2025, a small but important update was made to the methodology for the US small business employment index to continuously increase accuracy levels on the model that provides monthly employment estimates. From June 2025, the anonymized payroll data provided by these businesses will only be included in the Index’s sample when they use QuickBooks Online Payroll in two consecutive months, excluding months when businesses join or leave the platform. As before, the Index’s sample will continue to be benchmarked against official statistics to ensure the monthly estimates show employment for all US businesses with 1-9 employees, not just for QuickBooks customers, and all data is aggregated prior to publication. In the US, the size of the sample is currently 420,000 businesses using the QuickBooks platform. Further details of this update to the methodology can be found here.
Time series
The Index uses data going back to January 2015 in the US and Canada and to January 2018 in the UK. Published at the earliest opportunity every month, the Index shows the number of people employed by small businesses (in the US and Canada) or the number of job vacancies at small businesses (in the UK) in the previous month and how that number has changed since the month before. The Index helps to eliminate almost all of the time lags in official statistics by providing estimated projections of what those statistics will ultimately show when they are published.
Sample sizes
The total sample across all three countries is 533,000 small businesses. The US sample is 420,000 small businesses. The Canadian sample is 87,000 small businesses. The UK sample is 26,000 small businesses. The minimum sample sizes for regions or sectors to be included in the Index are 1,000 small businesses in the US, 800 small businesses in Canada, and 200 small businesses in the UK.
Target populations
In the US and UK, the Index targets the populations of small businesses with one to nine employees. In Canada, the target population is small businesses with one to 19 employees. The differences ensure the Index’s data insights are consistent with official statistics in each country, which are used for benchmarking during the calibration process. Timely data insights for these populations of small businesses are particularly valuable since most datasets fail to cover this portion of the economy well. Please note: Unlike in the US and Canada, the UK Index uses job vacancy data for calibration rather than employment data because official employment statistics are not currently available for small businesses on a monthly basis.
External data sources
External data sources used alongside the samples of anonymized QuickBooks Online Payroll customer data include:
- U.S. Bureau of Labor Statistics Business Employment Dynamics (BED) and Job Openings and Labor Turnover Survey (JOLTS)
- U.S. Bureau of Economic Analysis regions
Geographic regions
- USA data insights are divided into Bureau of Economic Analysis (BEA) regions
Industry sectors
- USA data insights are available by North American Industry Classification System (NAICS) sectors
Disclaimer
This content is for information purposes only and should not be considered legal, accounting or tax advice, or a substitute for obtaining professional advice specific to your business. Additional information and exceptions may apply. Applicable laws may vary by region, state or locality. No assurance is given that the information is comprehensive in its coverage or that it is suitable in dealing with a customer’s particular situation. Intuit does not have any responsibility for updating or revising any information presented herein. Accordingly, the information provided should not be relied upon as a substitute for independent research. Intuit does not warrant that the material contained herein will continue to be accurate nor that it is completely free of errors when published. Readers should verify statements before relying on them.
We may occasionally provide third-party links as a convenience and for informational purposes only. Intuit does not endorse or approve the views or opinions of any corporation or organization or individual herein. Intuit accepts no responsibility for the accuracy, or legality, of third-party content.
Recommended for you



Get the latest data insights in your inbox
Sign up to get the latest insights from the Small Business Index as soon as they are published each month.
Looking for something else?
Call Sales: 1-800-285-4854