Methodology
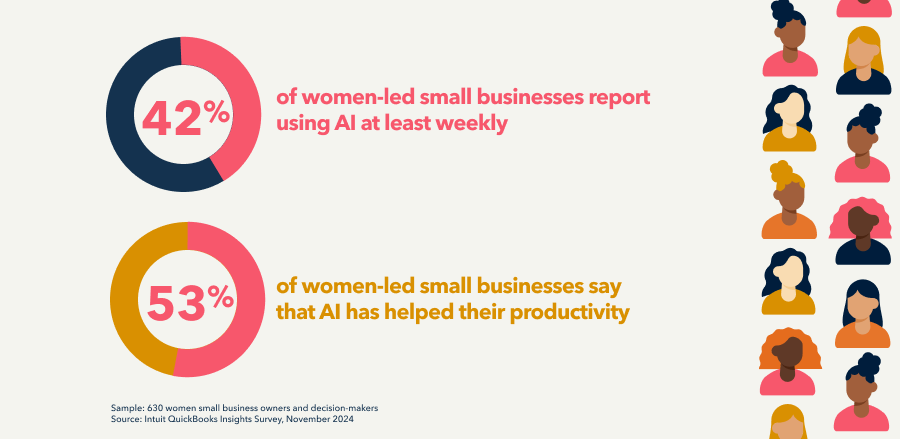
1. Small Business Insights Survey: Intuit QuickBooks Small Business Insights is an international, quarterly survey of small business health, opinions, and priorities commissioned by Intuit QuickBooks every three months since its launch in September 2021. Insights for the Women’s History Month data report come from the November 2024 US wave with a total of 1,357 respondents (630 women and 700 men). All respondents are over the age of 18. Participants are small business owners and decision-makers from two sources: (1) Dynata panel: on average, more than 50% of the respondents are small business owners. The remainder are senior decision-makers within small businesses who have a detailed knowledge of their employer's financial performance, workforce strategy, and business priorities. For each wave of the survey, 50% of the sample are repeat respondents who have previously taken the survey to allow opinions and business health to be tracked more effectively over time. Respondents receive remuneration. All responses are anonymous. In the US, all respondents are from small businesses with 0 to 100 employees. very effort is made to make these samples as representative as possible of small businesses in each country but as with all online surveys, there are limitations. To give the largest possible sample size for each wave of the survey, responses from the Dynata panel are combined with responses from the QuickBooks customer panel, described below, whenever possible. (2) Intuit QuickBooks customer panel: The number of survey participants drawn from the Intuit QuickBooks customer base varies over time. Respondents are drawn from a pool of QuickBooks Online subscribers in the US, Canada, and the UK who have been active in their accounts in the past 30 days. As with the Dynata audience panel described above, respondents in the US are typically from small businesses with 0 to 100 employees.
2. 2025 Intuit QuickBooks Small Business Index Annual Report: How higher interest rates have affected small businesses this year: Figures 52, 53 in this section (credit card usage, credit card payments and interest, and the distribution of average interest payments) plot
average values of credit card usage, payments and interest payments for an average small business in the US with 0 to 100 employees. The analysis is based on a cohort of 249,000 small businesses using the QuickBooks platform consistently between July 2019 and August
2024 and is reweighted by sector and region to make the insights nationally-representative. Figure 54 shows a comparison of 2022 and 2023 interest payments and is based on a cohort of 677,000 small businesses using the QuickBooks platform consistently in 2022 and 2023. In the first step, for each of these firms, we used anonymized data to calculate the total usage and value of payments on all of the credit cards used for business purposes and summed these values up to get a firm-level total. We then used the anonymized transaction descriptions to establish if the firm was charged interest on any of their credit cards and again summed these values up to a firm-level total. In the next step, we took the firm-level totals and aggregated them to sector and regional level cells. To make these nationally-representative, we then reweighted each cell to make the regional and sectoral cross composition of the firms align with the corresponding composition in the US economy. The figures shown in the report plot the averages of these nationally-representative statistics. As these are reweighted nationally-representative plots, they do not reflect the Intuit QuickBooks customer base or Intuit’s business.
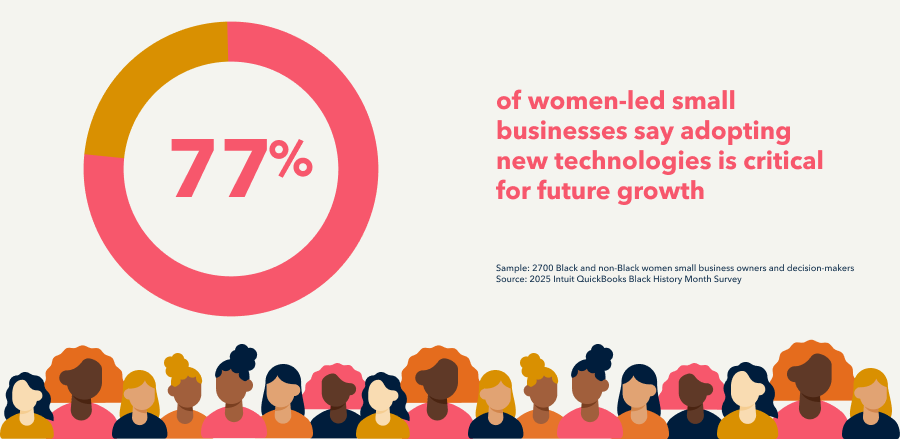
3. 2025 Intuit QuickBooks Black History Month Survey: In December 2024, Intuit QuickBooks commissioned an online survey completed in January 2025. The survey gathered insights from 2,490 Black and 3,000 non-Black small business owners and decision-makers aged 18 and over. This included 1,220 Black females and 1,480 non-Black females.
Reported differences between genders are statistically significant. For clarity, percentages have been rounded to the nearest whole number so in some of the stacked column charts shown above, survey responses may not add up to 100% but 99% or 101%, for example, instead. Please also note that all responses to multiple choice questions are shown as a percentage of the total number of respondents, not the total number of responses, to better reflect the number of people who chose each answer option. As a result, in the corresponding grouped column charts shown above, the sum of the percentages will always be greater than 100.