Big data for small businesses.
Growing a business

Beyond financial reporting: Summarizing big data into actionable insights

Scaling a business successfully can be an adventurous, experimental process. There’s no single way to do it, and countless advanced accounting tools, tricks, and methods abound to help you achieve your vision.


However, there’s a constant that underlies nearly every successful business strategy: data utilization. Growing businesses amass huge amounts of data, but it can take considerable effort to summarize that data into insights beyond basic financial reporting.


Let’s take a look at what comes after financial reporting: Learning to distill and summarize that data without feeling overwhelmed.

Brief overview

To harness the potential of big data, you first need to understand what you’re looking for. Data doesn’t automatically create insights—rather, you need to collect, filter, and analyze before you can convert the data into something usable (for example, KPIs). Manual data analysis takes skill, strategy, and time, but anyone can use smart reporting tools to help them make sense of heaps of data.


Big data has specific qualities called the “Five V’s” that separates it from traditional data, which we’ll explore more below. “Organized” isn’t one of those qualities, as neat and tidy information isn’t always available when it comes to working with large data sets from multiple sources.


When you collect data in big quantities, its structure determines how easy it will be to draw conclusions from it. Unorganized data can cause problems for your organization as you try to grapple with extracting value from an unstructured mess. Avoiding the fatigue that can come from unstructured data is key to a long-term plan for making use of big data.


Let’s explore the foundational DIKW Pyramid of big data collection and how it can help you understand the goals of big data collection.

The DIKW pyramid: How data, information, knowledge, and wisdom help scale your business

The DIKW pyramid.

The DIKW pyramid is the most popular framework for all data-driven decision-making for growing businesses. DIKW stands for Data, Information, Knowledge, and Wisdom, and refers to the way that data flows through an organization to become insightful and actionable.


The most rewarding part of amassing data in accounting software is pulling results from the intake. This is when data converts into information that helps build standard financial reports.


When the business data is filtered and tied to trends or goals, this shifts information into actionable knowledge that helps create takeaways. Tying that knowledge together with specific factors related to your business and market and analyzing it with strategic intent, in turn, creates wisdom, which is the best tool for building long-term profitability for your business.

A person standing in front of a vase filled with flowers.


New business? We've got your back

See why QuickBooks is the #1 accounting software for small businesses. **

Accounting information system (AIS): Wisdom in action

Once data makes its way up the pyramid and converts to wisdom, it’s known as an accounting information system (AIS), one of the primary sources driving strategic thinking in advanced financial reporting. The AIS and its associated wisdom can direct company investments in marketing and innovation that lead to business growth.


Example: Understand your company’s profitability beyond the product level. Look at profit by project, class, location, or by another customizable data field. Knowing your most profitable business segments allows you to either focus capital on those segments or glean takeaways to help less-profitable areas.


Profit & loss reports (P&L) and balance sheets focus on the past and don’t look to the future to help you make informed decisions.

With Smart Reporting from QuickBooks Online Advanced, you can make custom reports with Pivot Tables that summarize data trends into bite-sized bits of wisdom. Smart Reporting allows you to:


  • Define your quantifiable business goals, like growing your customer base or improving the customer experience.
  • Keep your data updated and track your financial, non-financial and budget data.
  • Select from more than 50 KPIs, including non-financial KPIs, to customize reporting specifically for your organizational goals.


For setting and tracking complex goals based on data, you need a competent tool that can help you manage large numbers of inputs in a single place. The most innovative companies around the world rely on big data to drive their most important decisions, and there’s no reason you can’t join their ranks.

Image Alt Text

Tools to fuel your people and passion

Connect payroll, time tracking, employee benefits, and accounting in one place, so managing more feels refreshingly manageable.

Big data for small businesses: What it is and how you can use it

Big data in five key elements.

Big data is more comprehensive and intricate than traditional, old-fashioned data. It’s a tool that helps companies in complex industries recognize patterns by analyzing large swaths of information from many inputs. Because of its complexity, analysis of big data can spawn solutions that address multiple problems at once.

Example: See big data’s troubleshooting in action by opening a GPS app on your smartphone and routing directions to a destination. The app analyzes countless inputs, including:


  • Maps to locate your destination and find the quickest route to it.
  • Other users’ locations to gauge pedestrian and vehicular congestion.
  • Historical habits to project a place’s popularity on a given day.
  • Weather reports to avoid forecast-related closures and seek reroutes.
  • Construction to look for faster routes in the event of a slowdown.
  • Social media to identify busy areas and locations of interest.
  • City plans to highlight spots like school zones, speed traps, and tolls.


The five V’s of big data define the tool’s key pillars: value, variety, velocity, veracity, and volume. More than just a tongue-twister, these five elements separate big data from traditional data.


  • Value: Big data provides immense, unique value to organizations.
  • Variety: Big data is available in many forms and expands beyond traditional databases. 
  • Velocity: Big data generates quickly and is often created and delivered continuously.
  • Veracity: Big data should produce accurate, high-quality results.
  • Volume: Big data is immense in volume when first collected.


Each V is relative to how an organization chooses to use the big data at its disposal. This is true for financial reporting, as your business’s goals will change the result you extract from any data set.

Three data structures: Structured data, semistructured data, and unstructured data.

Using big data: Data structure and organization

Big data comes from a variety of sources at a high velocity, just like the GPS example above. With so many sources (also known as the “data lake” of available data) and so little control over standardization, collected data can wind up in all sorts of packaging arrangements. This can get messy fast if there’s no remedy to tidy up the data as you collect it.


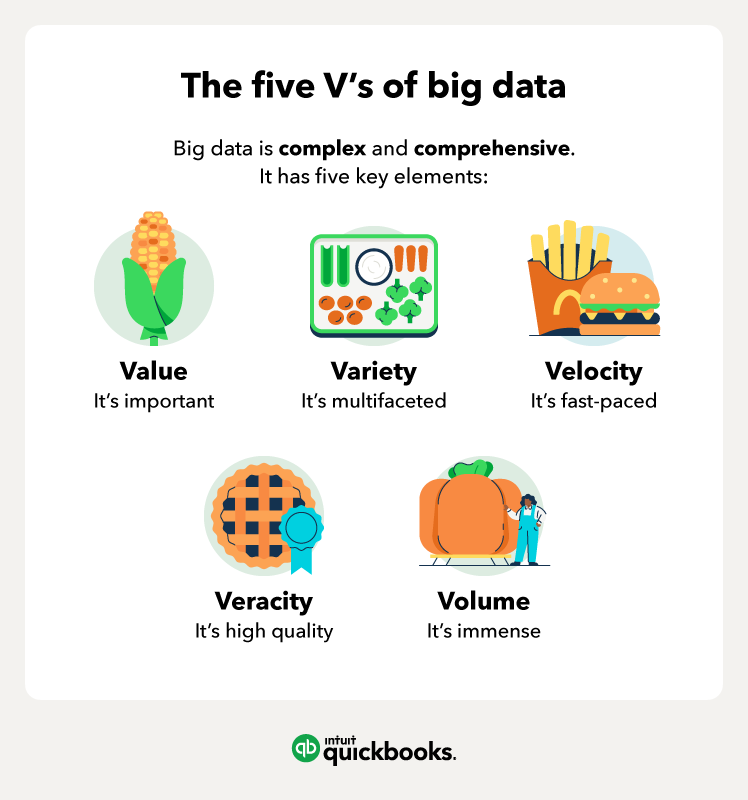
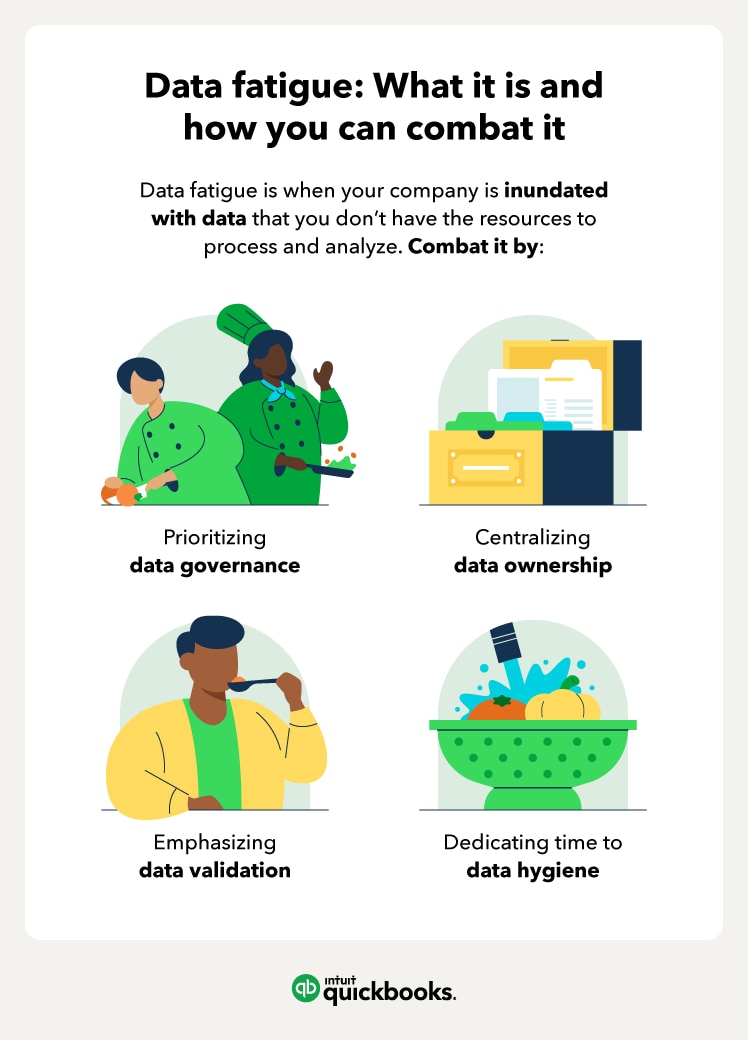
Fortunately, data governance efforts can help you rein in the mess. Data governance is a set of organizational rules for managing data in order to standardize its value, velocity, and veracity. Data governance policies can also ensure you always know:


  • Who owns what when it comes to your data.
  • When to audit data for industry compliance.


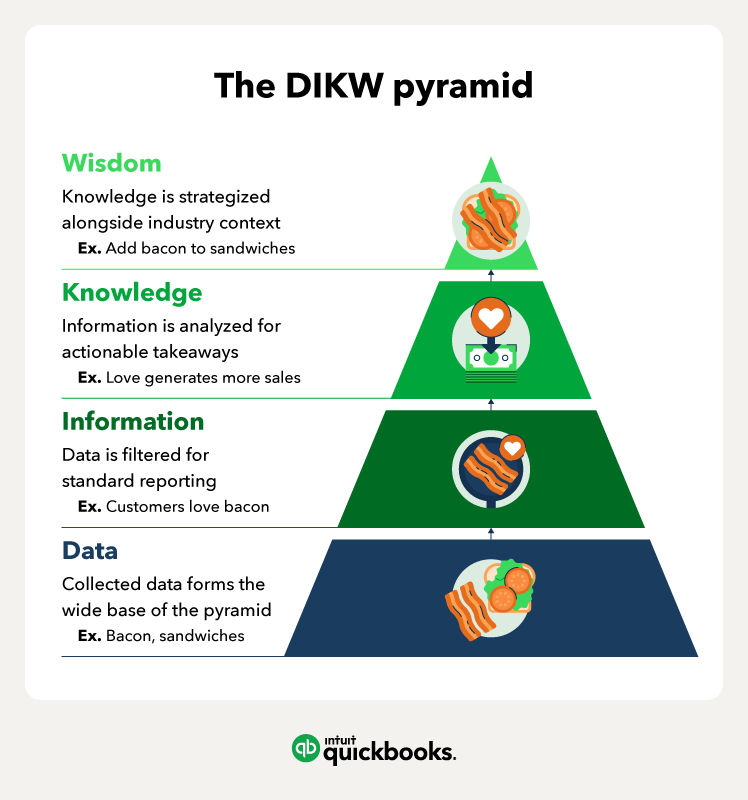
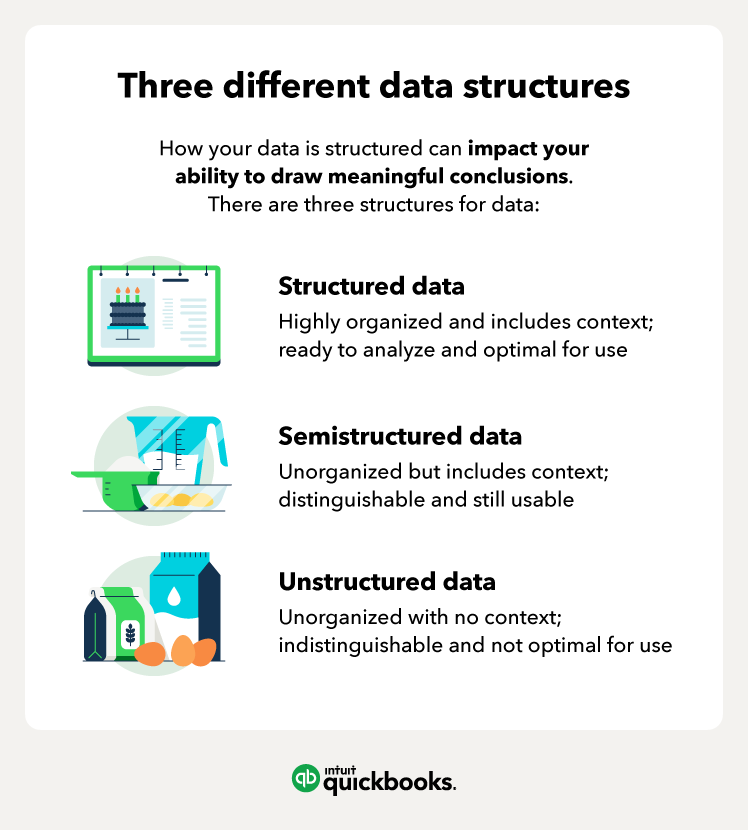
There are three overarching structures for collected data:


  1. Structured data is organized and readily available for analysis.
  2. Semistructured data is not organized but contains metadata to distinguish it.
  3. Unstructured data is not organized and not optimized for usage.

Example: Think of it this way. Structured data are complete reports and records organized with advanced accounting software, semistructured data are complete records with context that need to be organized and translated into reports, and unstructured data are piles and piles of notes and receipts.

No one wants to dig through a pile of receipts and the same is true for businesses working with unstructured data. It’s too complicated to untangle and isn’t optimal for most small businesses. That’s why you should think about how you collect your data—the more organized it is when you receive it, the less work you need to do.


Structured and semistructured big data can have a heavy influence on financial reporting, including shaping your company’s risk management, marketing efforts, and even customer relations.

Proactive risk management

There are numerous metrics that can help you to gauge the health of your business and forecast financial risks. Using big data, you can monitor your company’s overall progress and report on specific metrics like:


  • Vendor risk management (VRM)
  • Fraud detection and prevention
  • Customer loyalty and churn
  • Market share capture


Using risk management software for specific data collection can help you organize these insights into takeaways for financial reports on how to mitigate risks and reduce losses.

Targeted marketing

Marketing is a multifaceted industry that requires a multichannel or omnichannel approach for true success in today’s business landscape. With comprehensive views of your target audiences and detailed analysis of customer engagement, big data helps to:


  • Improve brand awareness
  • Increase customer acquisition
  • Save long-term marketing costs


Big data analytics for a tailored marketing approach involves looking at inputs like web usage and financial transaction history to spot prospective customers and find new ways to convert them. Those conversions are optimal for financial reporting and marketing plans, as are the details behind the conversion and how you collected them.

Comprehensive CRM

Detailed analysis of customer behavior patterns allows you to put your finger on the pulse of your client base: What do they need from you that you aren’t providing, and how can you pivot to address that need? When you infuse customer relationship management with big data analytics, you can more effectively:


By harnessing big data, you can create a more positive customer experience that translates into higher customer loyalty and lifetime value. Tracking long-term customers over time leads to valuable insights on your products and services that are useful context to include in financial reports.

What is data fatigue? Defeat it using 4 best practices for consolidating and distilling data

Data fatigue definition.

Data fatigue is when your company collects data faster than you can process and analyze it. With worldwide data creation on the rise and expected to grow rapidly through the next decade, it’s critical to understand data fatigue and learn measures to avoid and reduce this fatigue.


By prioritizing data governance and taking measures to organize and centralize data collection, your company will be better primed to draw meaningful conclusions with the data you collect. These four tips and best practices can help you combat data fatigue before it starts.

1. Make data governance a top priority 

Data can give traditional financial reports a contextual boost—but first, you need to know how you’re going to manage its collection. Tackling big data takes a team, and a data governance strategy should begin with assembling the right people to help you build your data governance policies and find any technology required to implement them.


  • Takeaway: Data governance is not a finite step in the data collection process—it’s always evolving. Revisit your policies quarterly to ensure that they don’t need updating based on new team members or technology.


Once you’ve clearly identified your company’s stakeholders in the data governance process, you can work toward implementing the process itself.

2. Centralize your data ownership 

Big data is voluminous in principle, but that doesn’t mean that you should get the entire company involved to tackle data ownership. It’s a helpful best practice to dedicate one single data owner, then build a team of data analysts and other professionals around them for support.


  • Takeaway: If you decentralize data ownership across different roles or departments, it could result in siloed data, or data that is inaccessible to teams outside of that role or department.


Centralization helps ensure that data is accessible to the teams who need it and that it’s always owned by a central, reliable source. It also helps to establish a single source of truth (SSOT), an overarching view of your database that’s reliable and current.

3. Verify and validate data to improve veracity 

Quality control is critical for data trustworthiness—if you can’t be sure that your data is trustworthy, how can you make accurate decisions from the conclusions that you draw? Whether you collect the data yourself or obtain it from third parties, you should look to verification methods to ensure accuracy.


  • Takeaway: By using validation tools and ensuring third-party data is vetted and verified, you can actually take in more structured and semistructured data than unstructured data and help to reduce data fatigue at the onset.


To verify third-party data, you need to confirm data collection techniques with your third-party partners. They should collect data from a variety of sources, and the data should align with what you already know about your customers—that is, it shouldn’t catch you completely off-guard.

4. Clean it up with data hygiene 

Data hygiene refers to the cleanliness of the data you collect. Structured data might already be hygienic, but it might also require inspecting and scraping data to reduce duplicates and eliminate unnecessary information that slows down the process.


  • Takeaway: If you’re able to, it helps to employ data scientists to cleanse inbound data regularly. However, data scientists are highly skilled and specialized, so outsourcing data cleansing to a third party can save costs for your organization.


Aim to clean up organizational data quarterly to keep records up to date. If quarterly maintenance is outside your capacity, you should cleanse data twice a year at least.

Let data lead your business to success

Big data may sound daunting, but it’s actually a revolutionary tool that has the power to change the way your business operates and plans for the future. By going beyond traditional financial reporting like balance sheets and P&L reports, you can take data and information and turn them into actionable knowledge and wisdom that give context to financial projections and forecasts.


For cutting-edge analytics and eye-opening insights, empower your business with QuickBooks Online Advanced and take your reports to the next level.


QuickBooks Online Payroll & Contractor Payments: Money movement services are provided by Intuit Payments Inc., licensed as a Money Transmitter by the New York State Department of Financial Services, subject to eligibility criteria, credit and application approval. For more information about Intuit Payments Inc.’s money transmission licenses, please visit https://www.intuit.com/legal/licenses/payment-licenses/.


Recommended for you

Mail icon
Get the latest to your inbox
No Thanks

Get the latest to your inbox

Relevant resources to help start, run, and grow your business.

By clicking “Submit,” you agree to permit Intuit to contact you regarding QuickBooks and have read and acknowledge our Privacy Statement.

Thanks for subscribing.

Fresh business resources are headed your way!

Looking for something else?

QuickBooks

From big jobs to small tasks, we've got your business covered.

Firm of the Future

Topical articles and news from top pros and Intuit product experts.

QuickBooks Support

Get help with QuickBooks. Find articles, video tutorials, and more.