You could save up to 25% on transaction costs².
Speak with us now to see if you qualify.
Talk to sales 1-800-515-8366
Monday - Friday, 6 AM to 4 PM PT

Table of contents
Table of contents
When margins on one or more live jobs begin to slip, they push group earnings below forecast. The board’s next question is whether the estimates underlying the rest of the portfolio remain reliable. Sureties get there faster. When they see repeated fade across your WIP, they tighten bonding capacity, tying up the liquidity you need for your next project start.
This article shows how construction reporting gives you job-level visibility into margins, cash, and WIP accounting for every active project, so you can make decisions and manage capital based on real numbers, not what the original bids assumed. It also covers how modern accounting systems add a monitoring layer that catches cost variances across jobs—before they impact your bottom line.
Construction reporting is the process of tracking financial performance at the job level, including revenue, costs, and profitability, across every active project. Without it, every board decision on capital allocation and cash planning decisions relies on estimates that haven't been checked against what's happening on site.
As companies take on more projects, maintaining that job-level visibility gets harder. Each new project requires more cost codes, more subcontractor billing cycles, more change orders, and more percent-complete estimates to validate. Spreadsheet-based tracking creates a delay between when costs hit in the field and when finance sees them, often stretching to weeks.
Construction reporting shows you which jobs are underperforming, so you can course-correct before their margins eat into the capital you've earmarked to fund future projects in the pipeline.
Construction reporting used to be a back-office reconciliation task. Finance teams used it to check how much had been spent on a project so far and what the project's margin was. Now, with real-time reporting platforms, growing businesses use it as a forward-looking financial control function to make capital and resourcing decisions from live project data.
The software connects field operations to financial outcomes. You see which projects are protecting their margins, which are consuming more cash than planned, and which estimating teams are consistently producing reliable bids. It provides lenders, sureties, and boards with project-level detail like information on percentage of completion for each job, and across the group, rather than relying solely on consolidated summaries.
You set the reporting standards across entities and jobs so the board and project managers work from the same figures, rather than debating which numbers are correct.
The four main types of construction reports offer different views of job-level performance. Here's how to use them and what's at stake when any of them is unreliable.
Job cost reports are a core part of construction project accounting, tracking labor, materials, and subcontractor costs by cost code against the project budget. In a high-functioning finance team, this isn’t a monthly look-back; it’s a weekly pulse check. Controllers review committed costs against actuals to spot spikes in material prices or labor hours before they compound.
When job costing is wrong, projected margins are wrong, and capital allocation decisions built on those margins carry that risk forward.
Accuracy matters when you work on tight margins. CFMA's Financial Benchmarker found that the average construction company earned a net income before tax margin of just 6.7% in 2024, leaving little room for error. A single job that overruns its cost estimate by 10% can wipe out the profit on the project and drag down group earnings with it.
That risk grows when costs across the sector are rising. For example, construction wages rose approximately 4% year-over-year, and labor represents 20–35% of total project costs. A two-week reporting delay is enough for the margin on a tight job to deteriorate without finance knowing it.
With margins that tight, catching a cost overrun sooner leads to a conversation with the project manager on how to recover it. Catching it at month-end leads to a write-down.
WIP reports track the financial status of every active project, including percent complete, earned revenue, and the overbilling or underbilling position. Finance teams use the WIP as their primary "truth" document during the month-end close to reconcile the balance sheet with project reality. Sureties scrutinize WIP reports closely when deciding whether to maintain or extend bonding capacity.
The gap between estimated and actual gross profit on a project, known as profit fade, is one of the clearest warning signs sureties watch for. To manage this, teams track "Estimated vs. Actual" side-by-side across the entire portfolio, allowing them to explain variances to stakeholders with hard data rather than anecdotes.
For example, the AGC/FMI Risk Study found that nearly 70% of respondents observed increased subcontractor distress or defaults. In *Construction Executive*, Jason Dettbarn of Merchants Bonding Company commented that sureties are now requesting tighter scrutiny of WIP schedules and cash conversion as a result.
WIP schedules built on validated job-level data are your strongest argument for maintaining or increasing bonding capacity when you present to your surety.
Project profitability reports give the CFO a job-level P&L for every active contract. Rather than waiting for a job to close to see if it was successful, finance leaders use these reports to view performance across multiple active jobs in a single dashboard. Over time, they reveal which project types, client types, and estimating teams consistently deliver margin and which don't.
According to Turner & Townsend's International Construction Market Survey the typical contractor profit margin built into a medium commercial project averaged 7.0% globally before work starts. By the time the job is finished, labor, materials, and change orders have usually eaten into that number.
With margins that thin at the project level, two or three underperforming jobs that go unchecked are enough to tip the portfolio from profitable to loss-making.
Project profitability reports show you where the margin is fading early enough to intervene on scope, pricing, or resourcing.

Tracking profitability by project type and client over 12+ months gives your estimating team the data to price bids more accurately. The mistakes that prevent growth in construction companies often start in the estimating stage, not on site.
Construction cash flow reporting forecasts inflows and outflows across the project portfolio. Draw schedules, retainage, and subcontractor payment timing make construction cash flow more complex than in most sectors. The day-to-day workflow here involves mapping out the cash gap—the period between paying out for labor and materials and receiving the progress payment from the owner.
Retainage terms are set in construction contracts and typically range from 5% to 10% of each progress payment. Some states now cap retainage by law, and others impose clearer limits on how long it can be withheld or when it must be reduced. With contractors typically building just 7% margin into their bids and 5–10% of every progress payment withheld until project milestones are met, you're managing liquidity with very little room for maneuver.
When cash flow reports map retainage release dates, draw schedules, and subcontractor payment obligations at the project level, you build a cash flow forecast showing how much capital becomes available and when. You then can plan the next project start around scheduled balances rather than assumptions.
Margin erosion, cash flow strain, and distorted WIP all stem from the delay between when you incur costs and when finance sees them. Real-time reporting closes that gap by connecting field activity to financial data, so you see the impact of costs in real time.
Four capabilities make the difference:
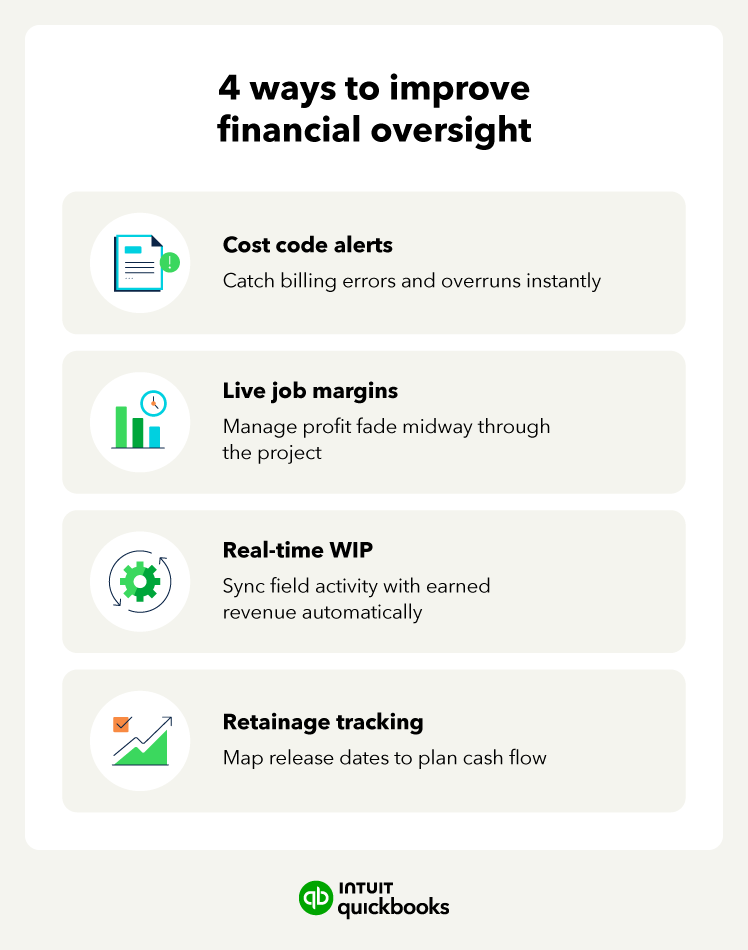
Traditional reporting relies on manual end-of-period reconciliations, meaning finance often discovers cost overruns weeks after the money is spent. By then, a small variance has already affected concrete into formwork and structural steel, and isolating where the original overrun happened takes longer than fixing it.
You see the overrun as it happens by running variance monitoring at the cost code level. For example, a business running 40 active projects receives an alert that concrete costs on a highway project have exceeded the budget line by 12% over the past two weeks. Finance reviews it, identifies a billing error from a subcontractor, and sends it back to the project team for correction before the month-end close.
That same approach will catch billing errors, unpriced change orders, and material cost escalations across your organization’s projects. Act on them now, and the project manager sorts them out. Miss them, and they’ll end up in your WIP.
Margins often look healthy on paper until the final phases of a project reveal costs that were never part of the original estimate. Scope changes, material escalation, and unpriced change orders build up gradually, staying invisible until the job nears completion if you only report periodically.
A live margin view compares total estimated costs with actuals and committed costs as they are incurred. For example, the margin dashboard drops from 8.2% to 5.1% on a $45M mixed-use project midway through structural work. The causes are unpriced change orders and material cost increases that hadn't been reflected in the estimate. Finance sees the fade at 55% completion rather than 90%, so they renegotiate the scope before the loss becomes permanent.
With live job margin visibility, you go into a portfolio review knowing which jobs are fading and why, while there’s still time to change the outcome.
When businesses produce WIP schedules manually, they are often outdated by the time they reach the surety. Manual preparation consumes days of finance time at period end, and all you have to present to underwriters is a backward-looking snapshot.
With continuously updated WIP data, percent complete, and earned revenue, field activity is reflected in real time. For example, a specialty contractor running 15 active jobs identifies a $2M underbilling on a project at 85% completion, caused by an unapproved change order that triggers scrutiny from the surety.
Because the team identifies underbilling before the quarterly schedule, they document the change order and present a full explanation to the surety at the surety meeting. With that out of the way, the meeting focuses on the capacity of the next project.
Real-time construction project reporting eliminates the period-end crunch and allows you to review project performance on any day of the cycle, to your schedule.
Retainage is often tracked in separate spreadsheets. When 5–10% of every progress payment is held back across 25 concurrent projects, the total receivable is spread across too many files for anyone to see the full picture.
Automated retainage tracking lets finance track retainage on both receivables and payables. For example, a business with $3.8M in retainage receivable across 25 projects sees that $1.2M is due for release within 60 days as three projects reach substantial completion. Finance maps those releases against upcoming subcontractor payment obligations and confirms that the funds will be available without drawing down a credit line.
When every retainage balance has a release date, it stops being trapped cash and becomes a receivable that finance can plan for.

When choosing or upgrading construction reporting software, finance leaders managing a growing project portfolio should prioritize these six capabilities:
Evaluate these six capabilities before you scale. At 50 active projects, you need to trust every margin figure in the portfolio, know how much cash you’re likely to have and when, and file WIP schedules that build surety trust in your organization.
Switching platforms mid-growth is expensive and disruptive. Construction companies that evaluate reporting capabilities before they hit 30+ active projects avoid rebuilding their financial infrastructure under pressure
Traditional reporting tells you what happened, but only when someone runs the report. AI adds a continuous monitoring layer across portfolio, cost code, billing, and schedule data at a volume no finance team working manually can match.
In practice, AI monitors cost variance patterns across projects. It identifies, for example, a subcontractor whose billing consistently spikes in month three of every project, or a material cost anomaly that warrants review before it compounds into an overrun. Over time, it improves forecasting accuracy by incorporating historical project performance and cost trends across the portfolio.
AI monitoring gives you a portfolio-wide view of cost behavior that spans every project team simultaneously. Patterns that would take months to surface through individual project reviews are visible early enough to act on.
Example: A construction company’s AI monitoring layer identifies that concrete subcontractor costs are running 9% above estimate across three highway projects, a pattern that only becomes visible when the data is analyzed at the portfolio level. The CFO investigates, discovers the subcontractor’s rates have moved above the estimate across multiple jobs, and renegotiates before the variance rolls through the remaining project phases.
Construction reporting at scale gives you the job-level data to protect margins, maintain bonding capacity, and forecast liquidity across a growing portfolio. When you treat reporting as a financial control layer, you catch profit fade, retainage drag, and cash flow strain before they reach the group result.
If your surety still receives WIP schedules built from spreadsheets that are weeks behind the field, see how QuickBooks Online Advanced gives construction finance teams the visibility to track every active project with more confidence.

Call Sales: 1-800-285-4854