








You could save up to 25% on transaction costs².
Speak with us now to see if you qualify.
Talk to sales 1-800-515-8366
Monday - Friday, 6 AM to 4 PM PT

Table of contents
Table of contents
Growth can make a business look healthier and make its weak spots harder to see at the same time.
Revenue may be climbing while a project runs over budget. A long-standing customer may become more expensive to serve. Vendor costs can increase while pricing stays flat. Unbilled work can accumulate across a busy team. Each issue may look small on its own, but together they can quietly put pressure on profit.
The challenge for an owner is figuring out where the money is leaking before the company-wide numbers make the problem obvious. As the business adds more customers, projects, vendors, locations, and people, the information needed to answer that question can become scattered across spreadsheets, systems, and teams.
Finding profit leaks starts with better visibility into the parts of the business driving the numbers.
Processes that worked when the business was smaller can become harder to sustain as customers, projects, vendors, locations, and employees increase. More activity creates more transactions, more decisions, and more places for changes in cost or profitability to go unnoticed.
The problem gets harder when financial information is spread across spreadsheets, disconnected software, or different teams. You may have more data than ever, but still lack a connected view of what is driving the numbers.
That makes it harder to answer the questions that matter when margins move: Which project went over plan? Which customer became less profitable? Which location is underperforming? Where are costs rising faster than expected?

Profit leaks can show up in several recurring areas as a business grows:
Scope creep, underestimated timelines, and unplanned costs build up as a project moves along. If budget-to-actual comparisons don't happen until the project closes, there may be fewer options left to address the margin impact.
A customer that was profitable at signing can become less profitable as service demands grow while pricing stays flat. Company-wide results may still look healthy even as the cost to serve an individual account rises.
Billable hours and reimbursable costs can fall through the cracks when multiple projects, consultants, or job sites are active at the same time. Those gaps can remain hidden until someone reconciles time and expenses against what was actually invoiced.
Small supplier price increases can be easy to miss when purchases are spread across multiple vendors or locations. A retailer working with several vendor contracts might not catch a small packaging cost increase until the annual renewal, well after it's been paid a dozen times over.
Without a way to compare results side by side, an underperforming location or department can blend into an otherwise healthy company-wide total. Segmenting performance makes it easier to see where results are diverging.
As more systems are added, the same information often gets entered more than once. Re-entering the same numbers between disconnected tools invites small mistakes, and those mistakes add up. Each one is minor on its own, but together they consume time, reduce confidence in the numbers, and make reporting less reliable.
Company-wide financial reports are essential for understanding overall performance. But they don't always show where a change in profitability started.
Finding a profit leak often requires looking beneath the total: by project, customer, service, location, vendor, or another meaningful part of the business.
Common gaps include:
Finding profit leaks depends on looking at the right financial information at the level where the change is actually happening. This allows you to identify changes early enough to decide what deserves attention.
Overall profitability doesn't always tell you where margins are slipping. For example, a services firm running five active client accounts might look profitable overall, while one account has cost more to service than it's brought in for two straight quarters.
Break profitability down by project, customer, service, or location to identify the areas that need the most attention.
Tools, such as QuickBooks Online Advanced, let you track performance by class, location, or custom field.
Waiting until a project closes to compare estimates against actual costs leaves little opportunity to recover lost margin. Reviewing those numbers weekly or at key project milestones keeps estimates, budgets, and actual costs aligned throughout the project. A mid-project review may reveal higher labor or material costs than expected, giving you a chance to revisit scope, staffing, or pricing.
QuickBooks Online Advanced brings budgets, forecasts, and actual performance together, making those reviews easier.
Include vendor cost reviews in your regular reporting cycle. Looking at recurring expenses side by side from one reporting period to the next helps separate normal spending from changing supplier costs.
With a tool like QuickBooks Online Advanced, businesses can quickly review vendor spending over time without manually pulling historical transactions.
Unbilled work and missed pass-through expenses can put pressure on realized project margins when they aren't captured in the billing process. Reviewing them regularly helps you identify work or costs that still need attention before the project moves further along.
QuickBooks Online Advanced helps businesses review billable expenses alongside invoicing, making it easier to spot items that still need to be billed.
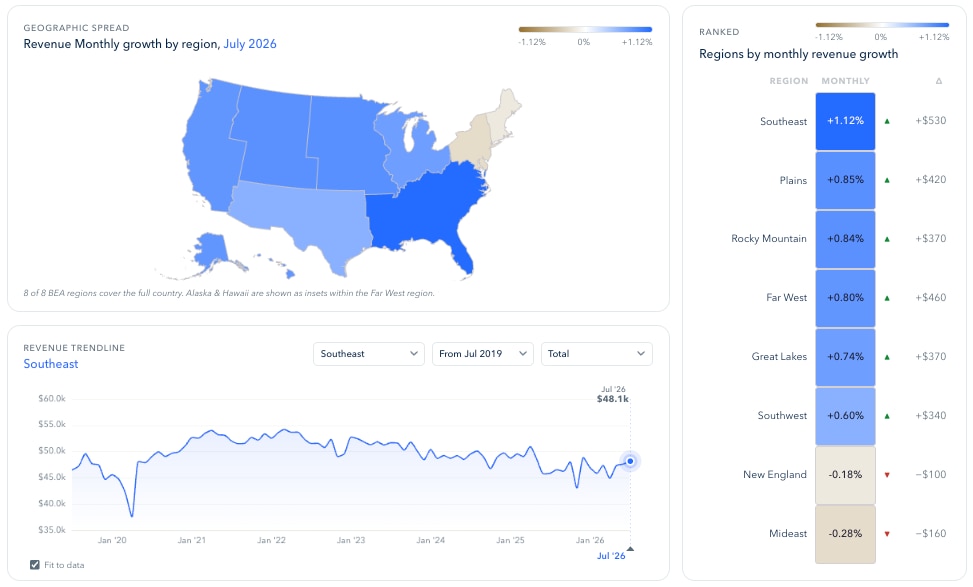
Build dashboards around the questions you need to answer most often. Which locations are missing their margin targets? Which projects are running over budget? Which customers are becoming less profitable? Looking at those metrics together makes it easier to identify where performance is changing.
QuickBooks Online Advanced combines customizable dashboards with advanced reporting, while Spreadsheet Sync helps bring Excel-based work into the same view. Together, connected reporting and spreadsheet workflows can give you a more current view of performance without manually rebuilding the same analysis each reporting cycle.
Once the source of a profit leak is clear, the next step is deciding what to do about it. Better financial visibility can help you decide:

As your business grows, finding a profit leak gets harder when project costs, customer performance, vendor spending, reporting, and other financial information have to be pieced together across disconnected tools.
QuickBooks Online Advanced brings financial workflows and reporting into one platform, helping you look beyond company-wide totals and understand what is changing across the business. This helps you move faster from “profitability changed” to “here's what changed—and here's where I need to act.”
Discover how QuickBooks Online Advanced can help you manage growing complexity with greater visibility.

Call Sales: 1-800-285-4854