








You could save up to 25% on transaction costs².
Speak with us now to see if you qualify.
Talk to sales 1-800-515-8366
Monday - Friday, 6 AM to 4 PM PT

Table of contents
Table of contents
According to Intuit QuickBooks research, small construction firms lost an average of $45,610 in revenue last year, even while they added people and won more work. Their pipelines might have looked full, but their take-home profits shrank anyway.
That gap is where project cost management shines.
Project cost management gives your team a review rhythm that turns cost data into decisions. Construction financial management tools let teams review costs and profits all in one place, so you always know where the money's going.
Today, we'll look at how scaling contractors can build that structure, and how QuickBooks Online Advanced helps to surface what a single controller can't catch by hand.
In a new team, your instinct is to treat an overrun as a single failure. Whether it's a bad bid or a hard job, you chalk it up to growing pains and move on. But that framing misses how the problem works. Overruns in multi-project firms almost never come from a single large miss. Instead, they come from many small misses over time.
You can catch the accumulation by understanding why it happens:
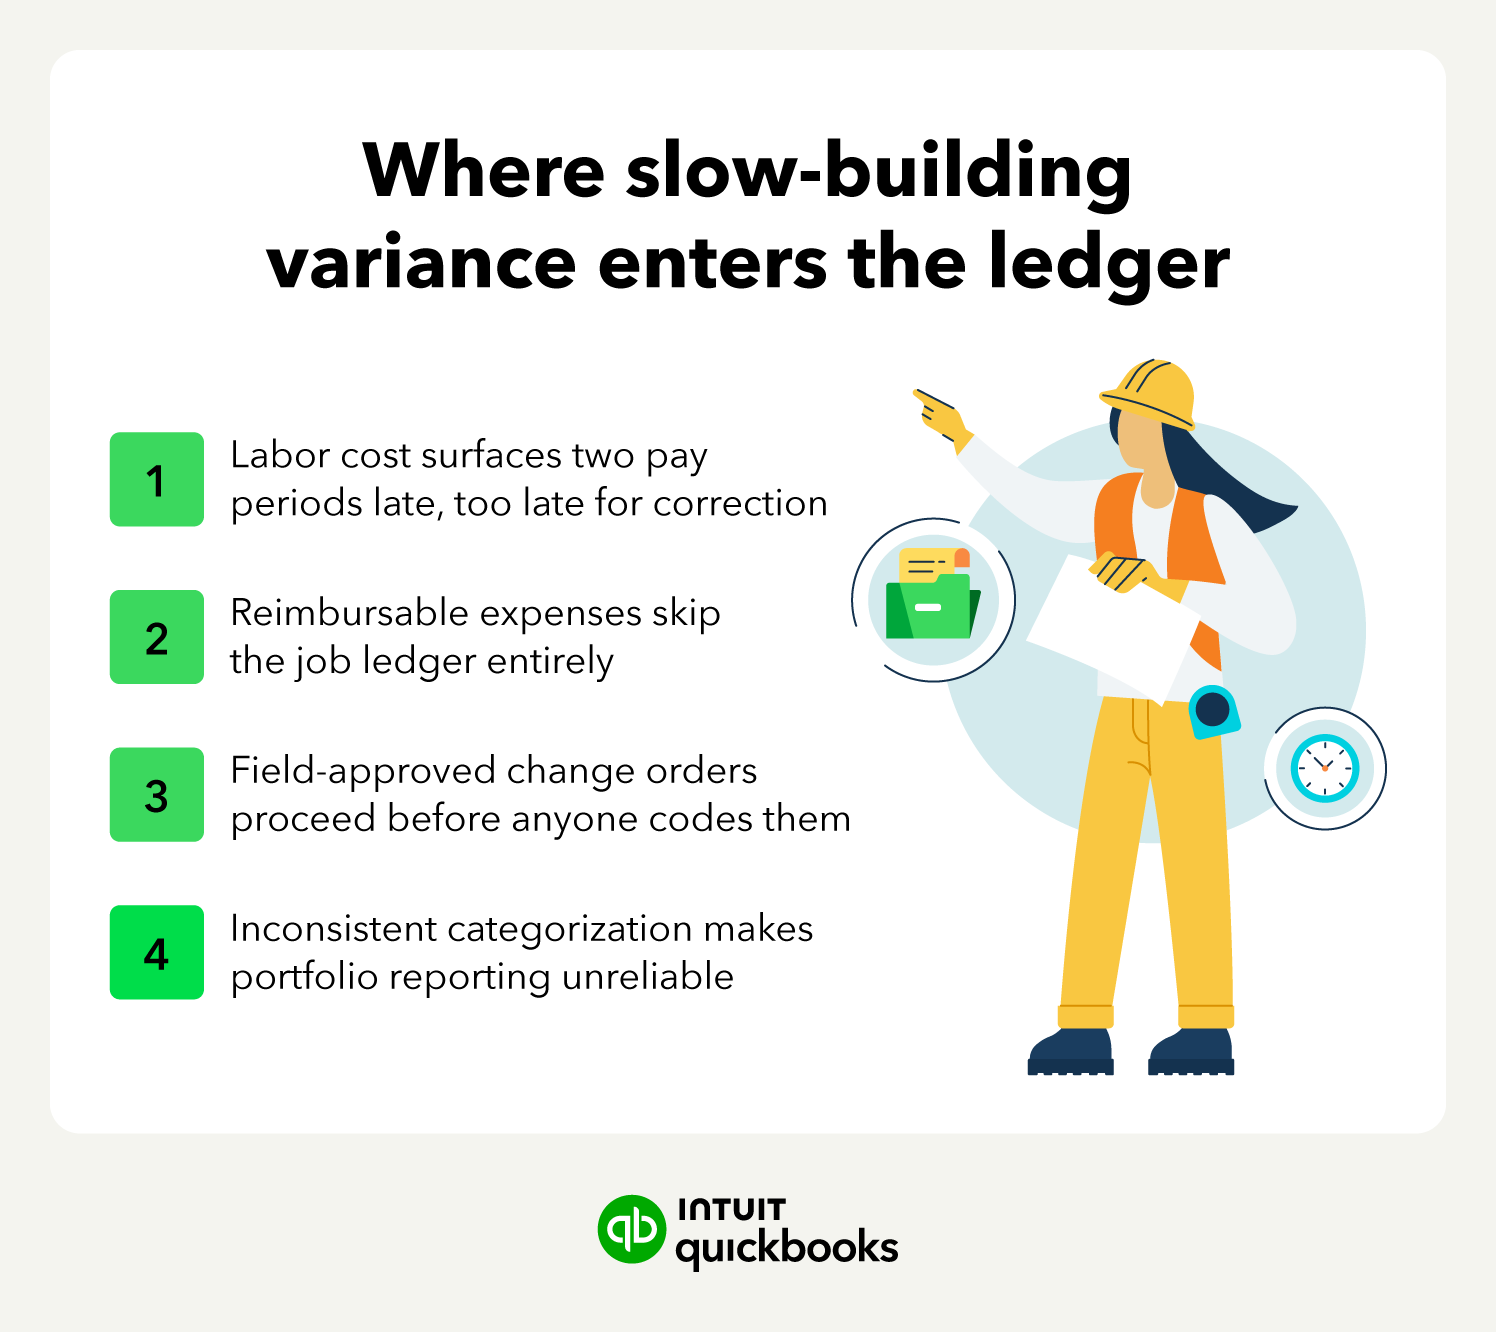
Here are the four most common sources of variance:
Individually, none of these gaps alarms a controller. A few days' lag on labor, a handful of unsubmitted receipts, or one change order coded late don't feel like huge issues. The trouble is that they don't happen individually.
They happen at the same time, across every active job, every week.
Late visibility forces late decisions. When you discover a labor overrun two pay periods after the fact, your only remaining levers are reactive: eat the margin or push the schedule.
The cost is already sunk. The same blind spot that cost you margin on this job also feeds bad assumptions into your next bid. If you never captured the actual cost to deliver this project type, you'll underbid the next one the same way. The overrun doesn't just damage the current job; it propagates into your estimating model and continues to impact you negatively.

Before you invest in better dashboards, audit how cost data is entered into your system. Most variance reporting problems in scaling teams are data-capture issues, not data-analysis issues. A sophisticated report built on inconsistent inputs still produces decisions you can't trust.
You can't monitor cost drivers, run a variance cadence, or trust an AI-generated flag when the underlying job cost data isn't categorized consistently. Categorization is the foundation. Without it, every downstream report becomes noise.
Aim for a cost structure that means the same thing on every job, coded the same way by every project manager, so variance reporting compares like to like across the portfolio.
Most scaling contractors standardize on five cost categories.
These are broad enough to apply across project types, while still being specific enough to make variance reporting useful:
| Cost category | Common construction line items |
|---|---|
| Labor | Framing hours, finish carpentry, burdened crew time, supervision |
| Materials | Lumber, concrete deliveries, fixtures, hardware, consumables |
| Subcontractors | Electrical, plumbing, HVAC, specialty trade draws |
| Equipment | Rental, owned-equipment allocation, fuel, small tools |
| Other direct costs | Permits, dumpster fees, temporary utilities, project-specific insurance |
Preventing drift from this system is the hardest part. Lock the chart of accounts and the project/class structure so PMs can't invent new categories mid-project, and make sure to train each project manager on the specific categories they're authorized to use, and route every exception through the controller. The moment categorization becomes a field judgment call, your portfolio reporting degrades.
The Projects feature in QuickBooks Online Advanced ties income, expenses, time, and labor to a specific job under one set of categories. So you stop rebuilding job cost out of the general ledger after the fact (which is a miserable way to spend a Tuesday) and start capturing it against the project as the work happens.
That's the part that makes everything after it work. Same five categories on every job, and your reporting finally compares apples to apples across the whole book. Get this layer solid and the rest has something to stand on. Skip it and you're just decorating bad data.
Variance doesn't spread evenly across your cost structure. It concentrates on three drivers, labor, materials, and subcontractors, and each one leaks in a characteristic way. To catch it, monitor each driver where the cost commits, not where it surfaces at month-end.
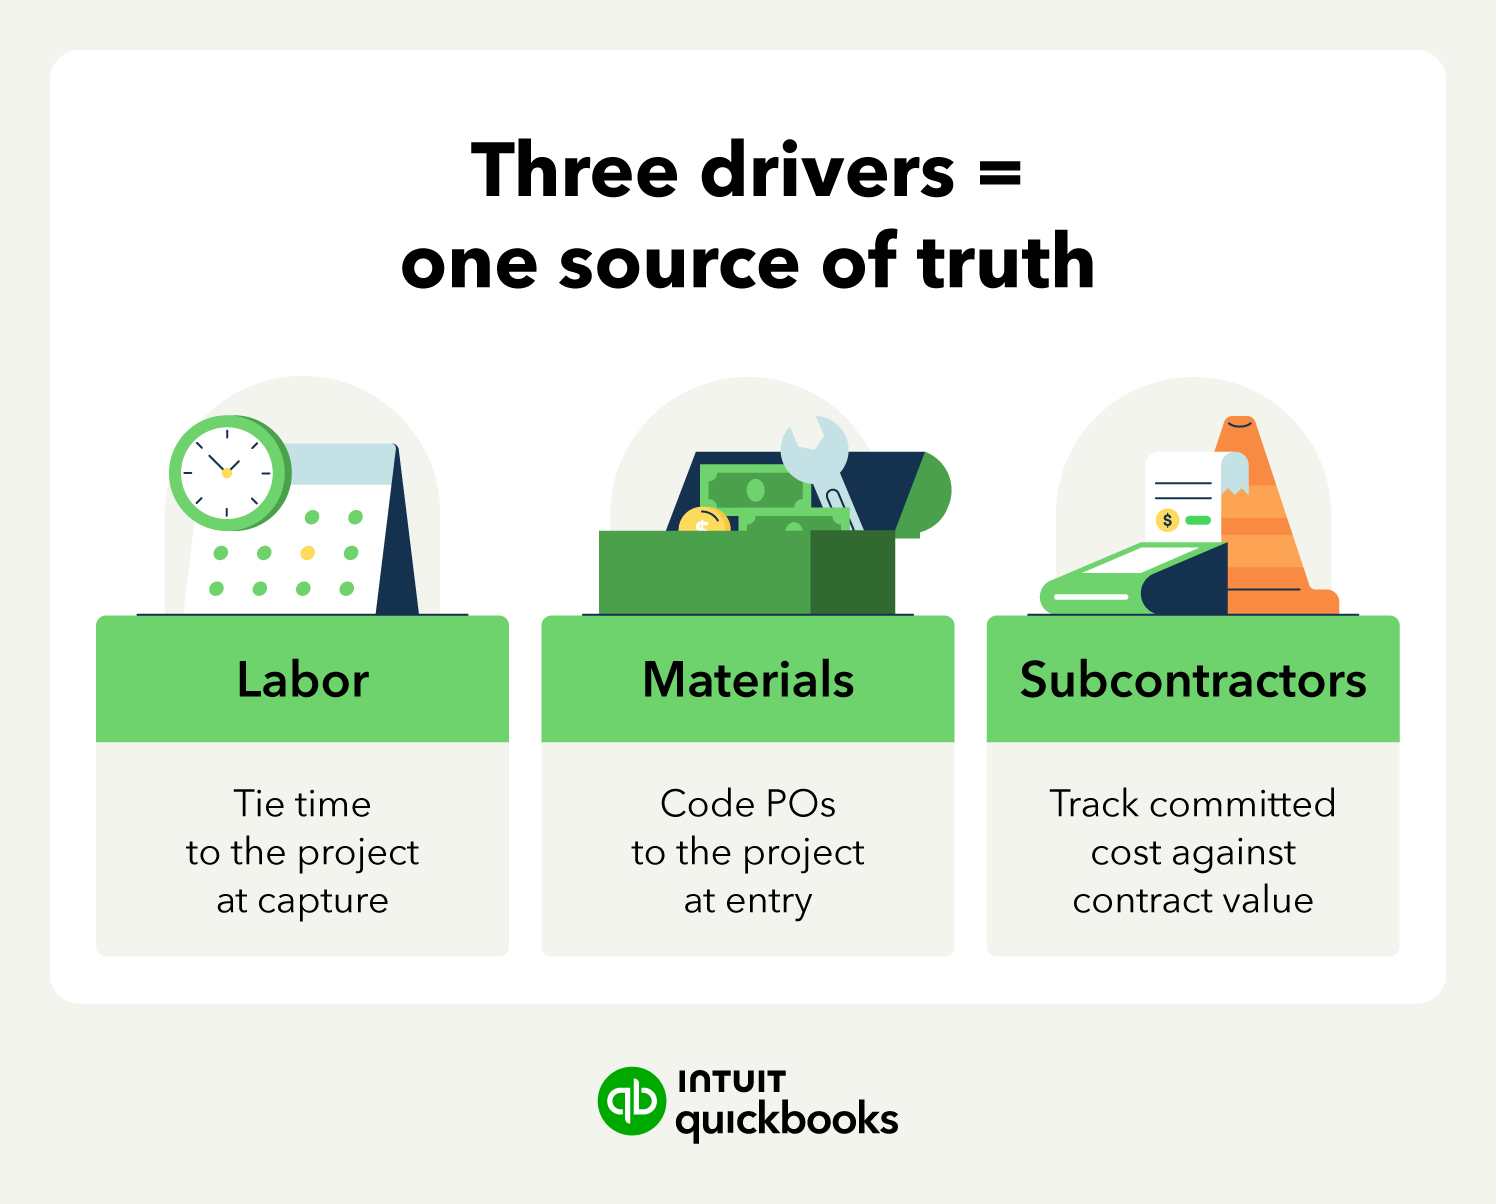
Get the hours onto the job the moment the crew logs them. With the QuickBooks Time integration in QuickBooks Online Advanced, crews can clock in against the job and phase right in the field, so labor costs land on the right project that day. No two-week wait for payroll to untangle it.
And that's the whole game, because now you can watch burdened labor against your estimated hours phase by phase, while the phase is still happening. Say you bid framing at 320 hours, and you're already at 280 with a third of the work left. You see that. Right now. While you can still shift a crew or rework the schedule. That's managing the labor line. Finding it at close is just doing the autopsy.
Code the PO to the job the day it goes out, not at month-end. Tie it to the project the moment you issue it, and you can see the committed cost right away, which means you know what you've already promised against the materials budget long before the invoice turns up.
Then look at price variance against the estimate every single week. Lumber comes in 12% over what you bid, and the PM and the controller both see that the same week, instead of finding out separately three weeks later and spending the next meeting figuring out whose fault it was. One shared view, one number, and the conversation stays on what to do about it.
Set a standing weekly report of committed versus estimated cost by project. The report itself isn't the point. The point is the PM and the controller working from the same number on the same day. Most material overruns drag on because two people stare at two versions of the truth.
Track committed cost against the subcontract value so you can always see what's left on each agreement. You write a $180,000 electrical sub, you've drawn $140,000, and that $40,000 of remaining exposure should be sitting right there, not buried in a stack of invoices you'd have to add up by hand at close.
The harder discipline, and the one everybody slips on, is catching the change order before the work starts. The sub flags extra scope, and the instinct is just to keep the job rolling, because stopping feels like it costs money.
Integrated tracking turns that step into something you can actually hold people to: code the change to the project and reflect it in committed cost before the crew touches it, so your contract value never drifts from the scope you're really building.
What do most scaling construction teams miss? It's this right here. They have cost data. What they lack is a structured review rhythm that turns that data into real decisions that have measurable impact on the business.
Here's the thing nobody tells you about a review cadence… it only works if you stop trying to look at everything at once.
So you split it by altitude. Each level looks at its own height, asks its own question, and hands the answer up to the next one. In practice, this might look something like this:
Weekly
The PM goes through their active jobs and looks for projects that came in higher than the estimate, so they're only looking at the exceptions. You want them on the handful of numbers that are moving while there's still time to do something.
Monthly
Monthly, the controller steps back and looks at the whole book, trended across jobs and job types. This is where the real patterns finally surface, the project type that always runs hot on labor, the region where materials keep beating the bid. You can't see that staring at just the one job.
Quarterly
This is the one people forget, and it's the one that pays. Estimating sits down with the completed jobs, figures out which categories keep coming in over, and feeds that back into the bid model.
That's the difference between cost management that just plays defense and cost management that actually makes you money. Last quarter's overrun becomes next quarter's sharper bid, before the job even starts.
A cadence with no owner is just a recurring calendar invite everybody declines. At every step in the process you need somebody who owns the review, somebody who escalates the variance, and somebody who closes the loop with a corrective action you can point to later. No owner = no decision.
Weekly, the PM owns it and kicks the threshold breaches up to the controller. Monthly, the controller owns it and kicks the patterns up to leadership. Quarterly, whoever runs estimating turns the findings into a revised bid. Everybody knows whose number it is.
A gorgeous dashboard with no owner produces nothing. People open it, nod, close the tab, and start thinking about lunch. A report that one named person has to act on every week will save you more margin than the slickest analytics package nobody's accountable for.
If your team is managing 10+ active jobs without a structured review cadence, you may be struggling to review transactions at scale. A single controller can't manually review every transaction across 20 to 30 active projects. There aren't enough hours… and that's exactly where overruns slip through.
AI-assisted features in QuickBooks flag unusual expense amounts, likely miscategorized entries, and transactions that fall outside historical patterns for a given job type. The platform reviews what a controller doesn't have time to and surfaces the handful of transactions worth a human's attention.
Fold the flags into the weekly review cadence rather than running them as a separate workflow. Anomalies become an agenda item: the PM and controller work through the flagged transactions alongside the threshold breaches, in the review they already run. AI does the scanning while your team gets to review and decide on the outcomes.
Cost overruns build up quietly, but they don't have to. If you categorize consistently and let AI-assisted flags stretch your reach across the jobs you can't watch by hand, you can catch variance while you can still act on it, then feed what you learn straight back into sharper bids.
QuickBooks Online Advanced brings project tracking, profitability reporting, and anomaly detection into one financial system, so your cost discipline scales with your project volume instead of breaking under it. See how QuickBooks Online Advanced puts structured cost control to work on every active job.

Call Sales: 1-800-285-4854